This post is a personal investment journal based on my own market study and observations. It is not financial advice or a recommendation to buy or sell any asset. All investment decisions and responsibilities belong to each individual investor, so please make careful decisions based on your own judgment and risk tolerance.
[Bitcoin, BTCUSDT.P]
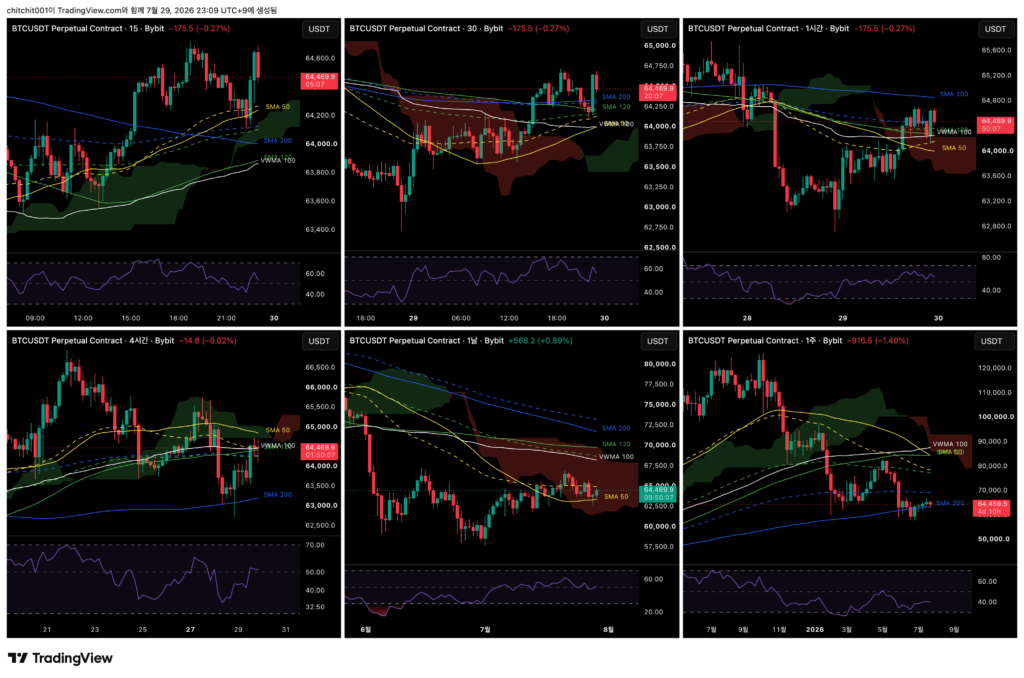
This is the comprehensive Bitcoin chart. From the upper left in a Z-shaped order, the timeframes are the 15-minute, 30-minute, 1-hour, 4-hour, daily, and weekly charts. Across all timeframes, the candles are moving near the moving averages. This looks like a good point to plan either a buy or sell strategy.
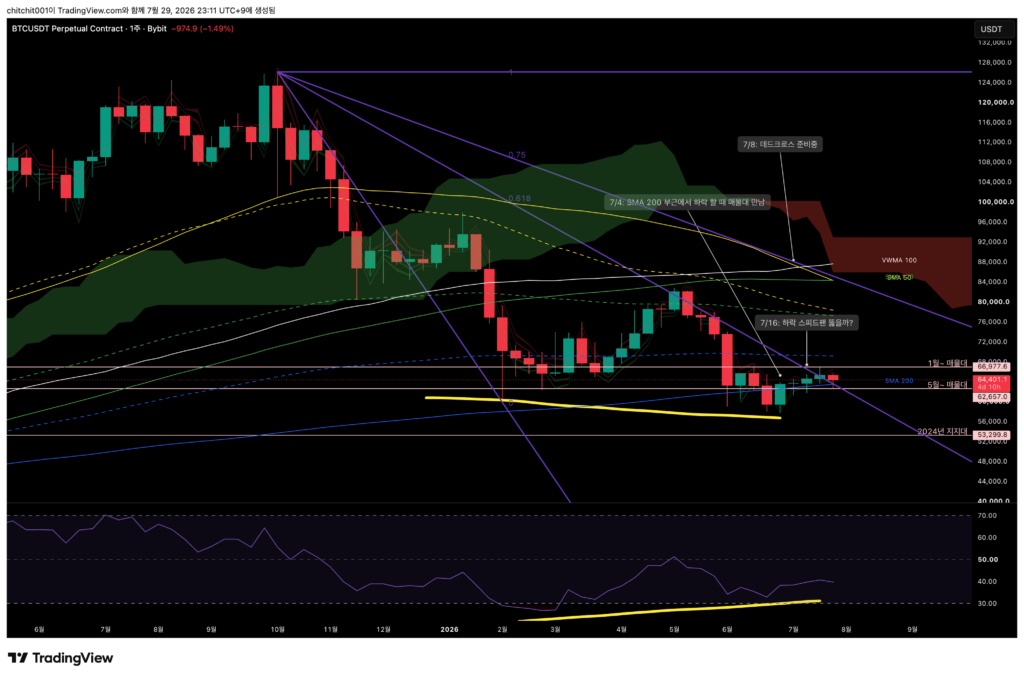
[Weekly Chart]
Bitcoin is moving through the 0.618 area of the speed fan.
Over the past week, price moved down near the center of the May volume zone and then rebounded. That was a very important buying point.
As long as the SMA 200 is not broken, Bitcoin is continuing to hold its position.
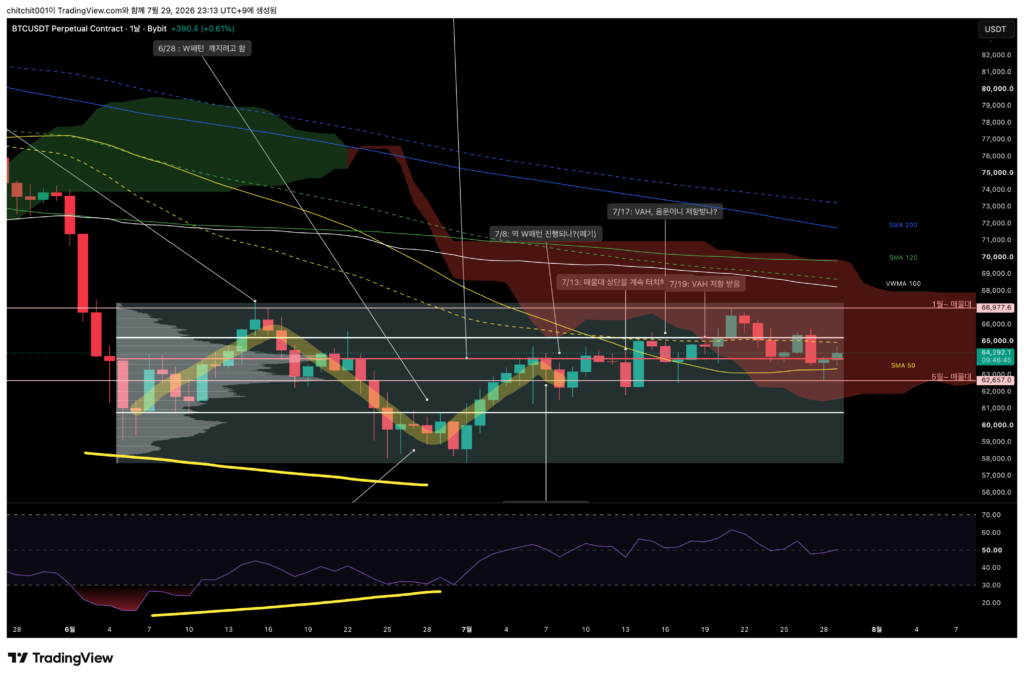
[Daily Chart]
A fairly tedious sideways range has continued, but price has finally reached the center area of the sideways volume zone.
At the current point, considering a buy looks reasonable. Just below, around $63,351, price meets the SMA 50, so that area could also be used as a stop-loss line.
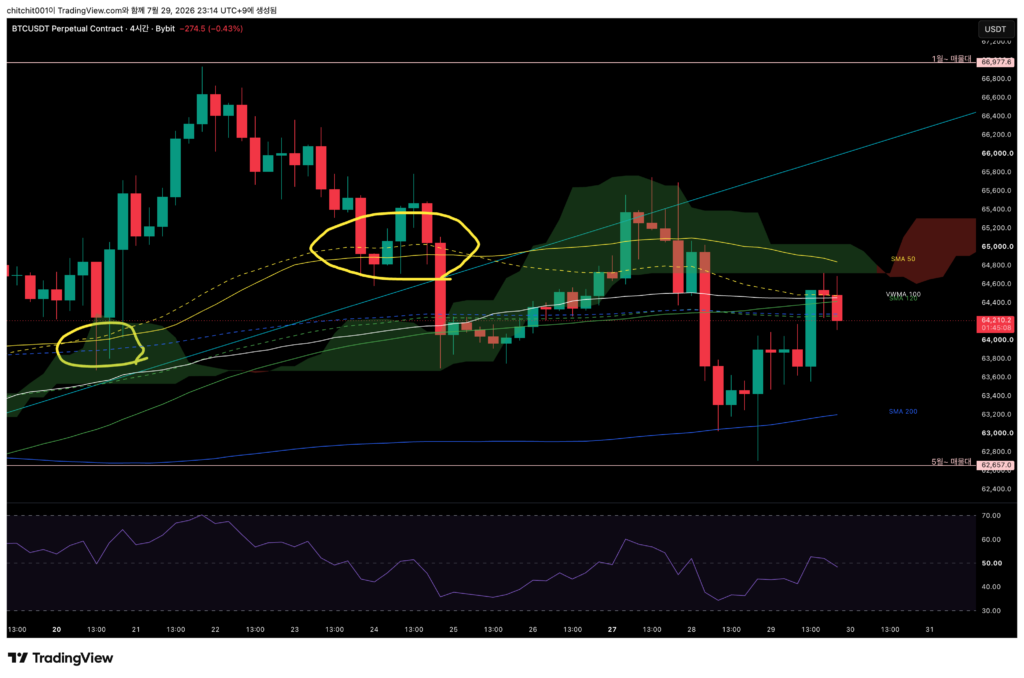
[4-Hour Chart]
Over the past few days, Bitcoin saw a fairly deep decline. In the end, however, it held the SMA 200 and is now moving higher again.
At the moment, price is fighting around the VWMA 100. For anyone who bought at the SMA 200, the current area may be a good point to take profit.
For those without a current position, considering a buy when Bitcoin clearly breaks above the VWMA 100 could also be reasonable.
[1-Hour Chart]
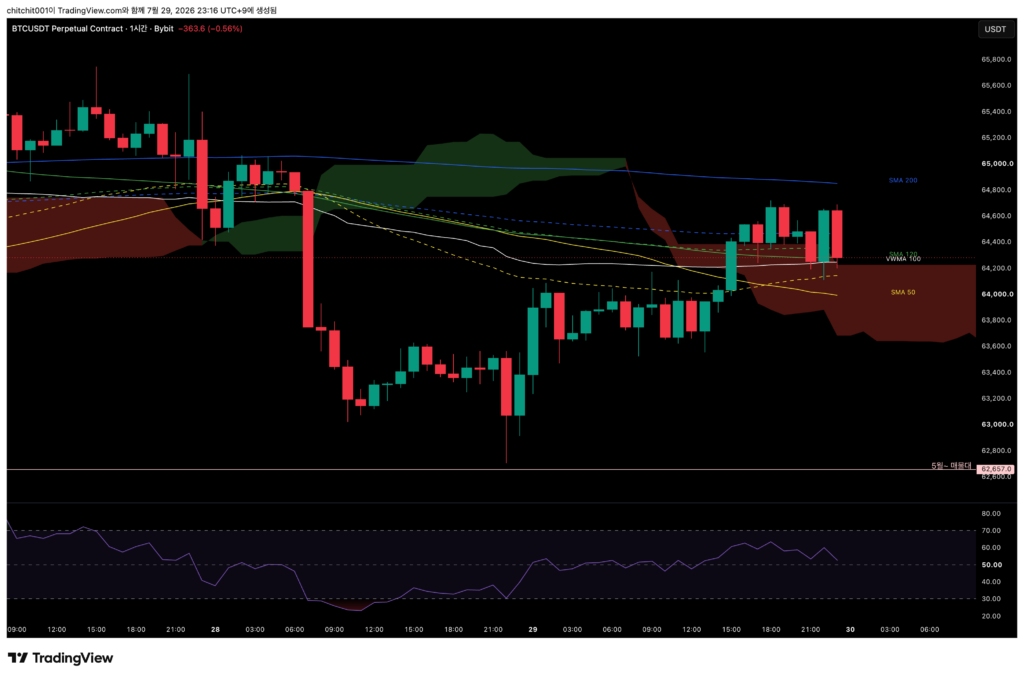
On the 1-hour chart as well, the VWMA 100 appears to be an important line. Since price has been receiving continued support here, it may be reasonable to enter more decisively and set a stop-loss below.
[Ethereum, ETHUSDT.P]
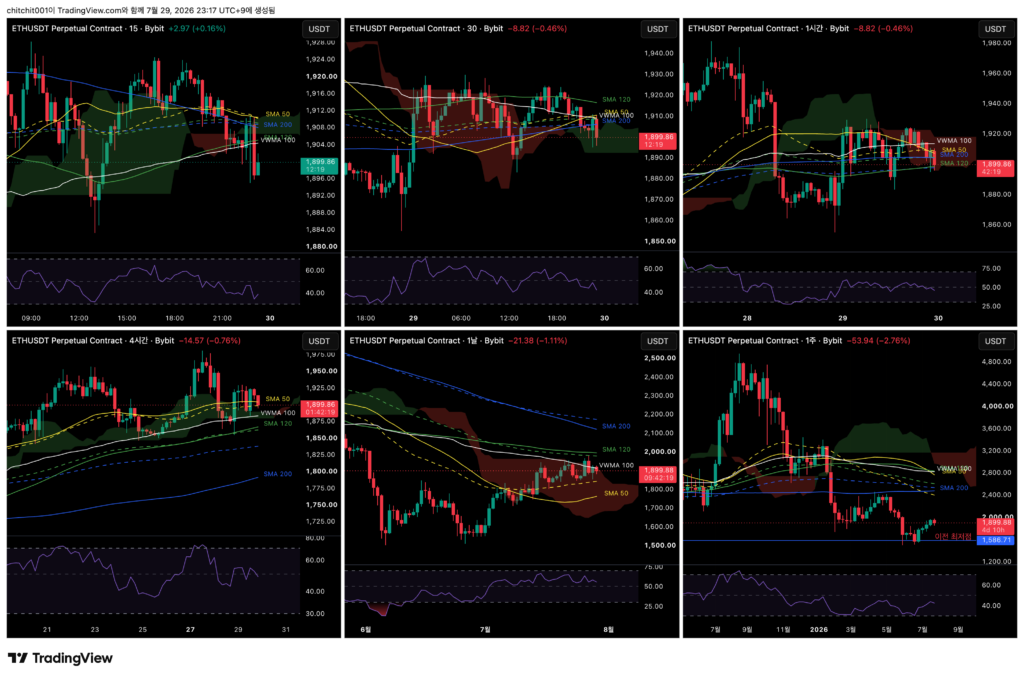
This is the comprehensive Ethereum chart.
[Weekly Chart]
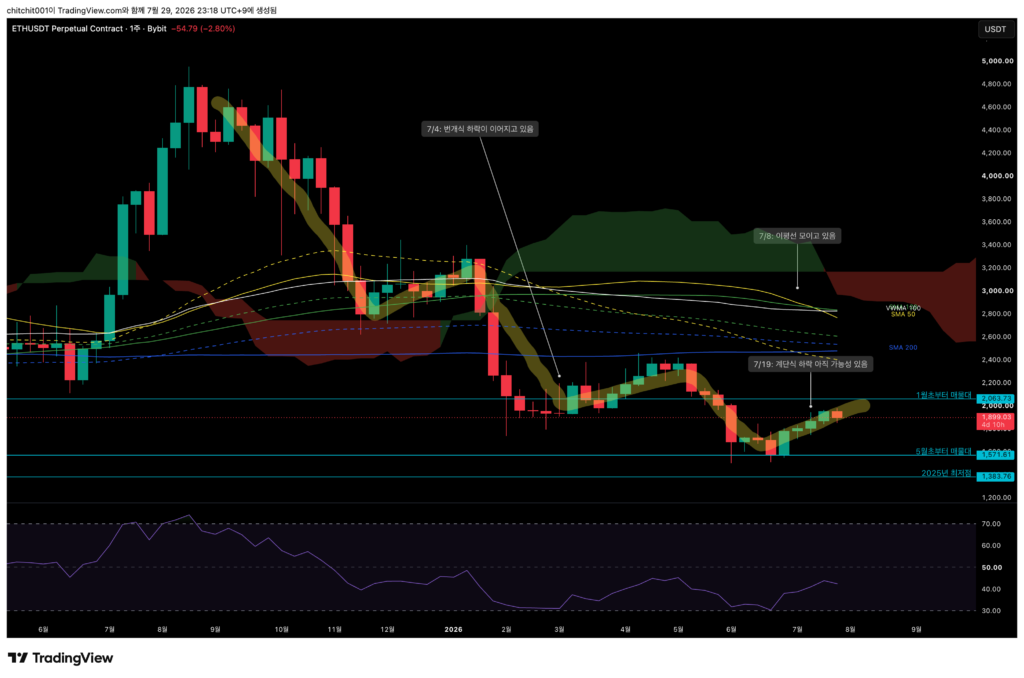
I am curious how long the step-like decline marked in the highlighted area will remain valid.
Currently, candles across several sections are moving upward. I wonder whether this is energy building up for the next decline.
Since we cannot predict everything, I think it is necessary to keep in mind that the step-like decline could resume at any time. At the same time, in preparation for a sharp rise, taking a position with a tight stop-loss could also be considered.
[Daily Chart]
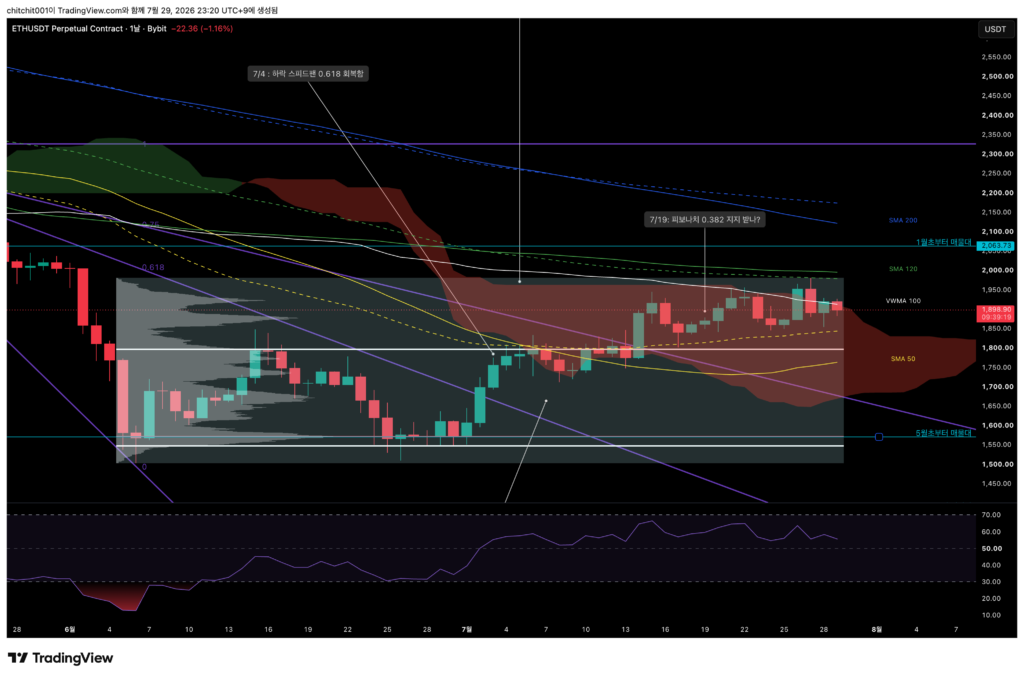
The VWMA 100 is acting as resistance, and today Ethereum still has not clearly broken through this line.
At the moment, price is near the edge of the bearish cloud, so it could gain strength here and move higher. On the other hand, it could also move back into the bearish cloud.
The reason I mention this is the same as what I said on the weekly chart: with a defined stop-loss line, taking a more decisive position may be reasonable.
If it were me, I think I would consider entering once the candle closes above the VWMA 100.
[4-Hour Chart]
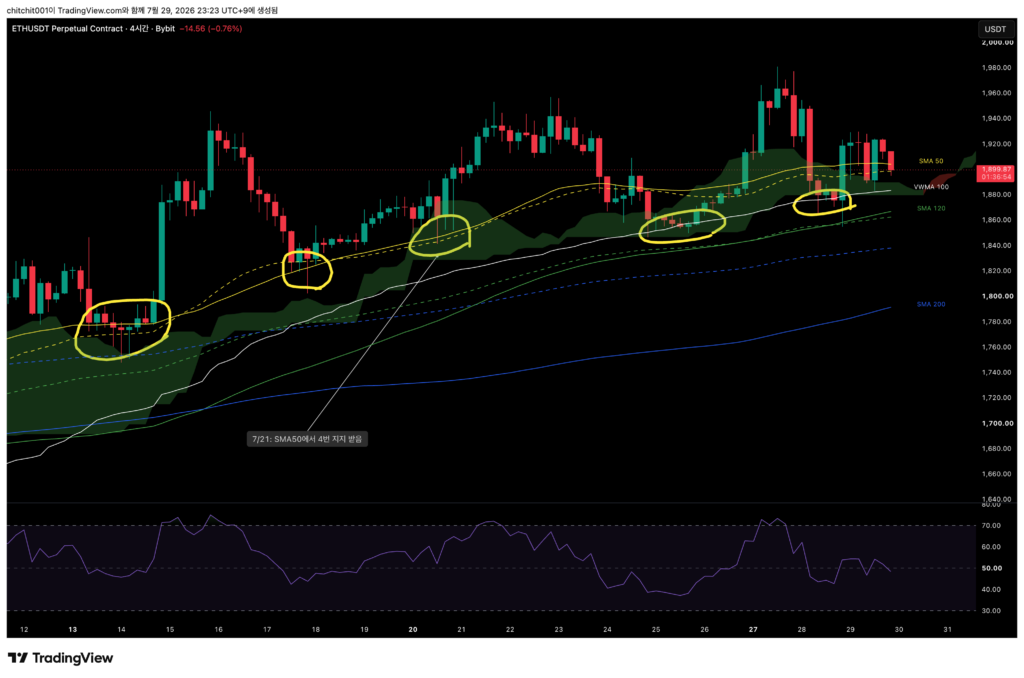
Look at the yellow circles. This is a pattern where price continues to receive support near the moving averages.
I think the word “pattern” is important here. It means that because price has moved this way in the past, there is a possibility it may continue to behave similarly.
At the very least, if the candle comes down to the SMA 50 or VWMA 100, it may be reasonable to take a position while assuming there is a high probability of support.
[1-Hour Chart]
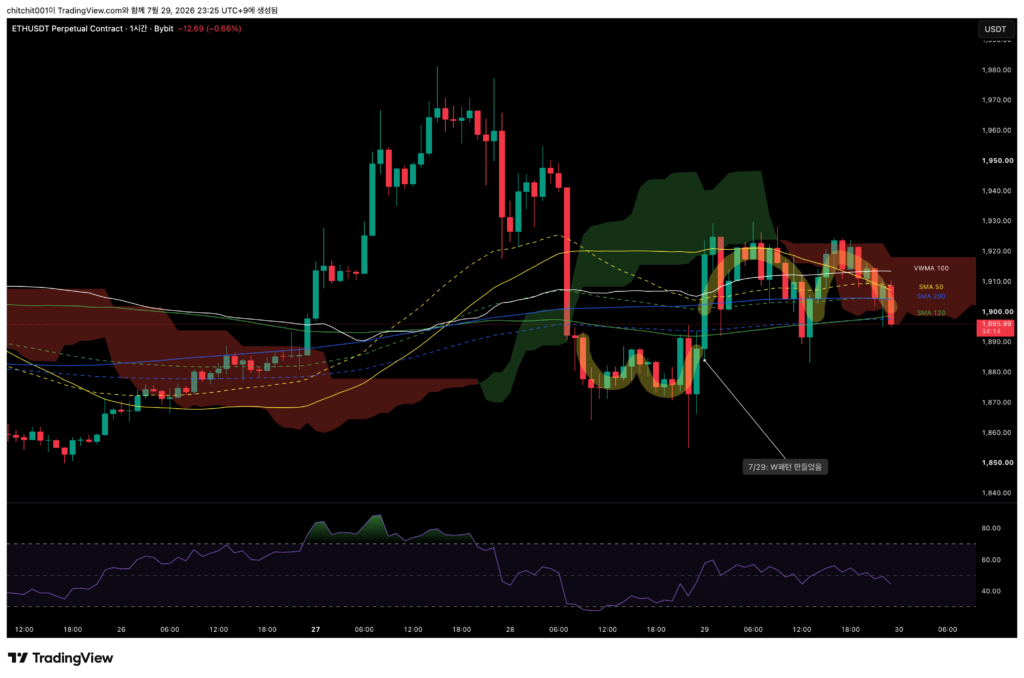
Ethereum is forming W patterns and inverse W patterns one after another.
On the short-term timeframe, this is clearly a downward pattern to anyone looking at it.
I mentioned that the longer timeframe may present an opportunity. If it is difficult to decide where to buy, the standard approach is to look for the moment on the shorter timeframe when the decline appears to stop and the trend seems ready to turn upward.
It is difficult, but that is the textbook method.