This post is a personal investment journal based on my own market study and observations. It is not financial advice or a recommendation to buy or sell any asset. All investment decisions and responsibilities belong to each individual investor, so please make careful decisions based on your own judgment and risk tolerance.
[Bitcoin, BTCUSDT.P]
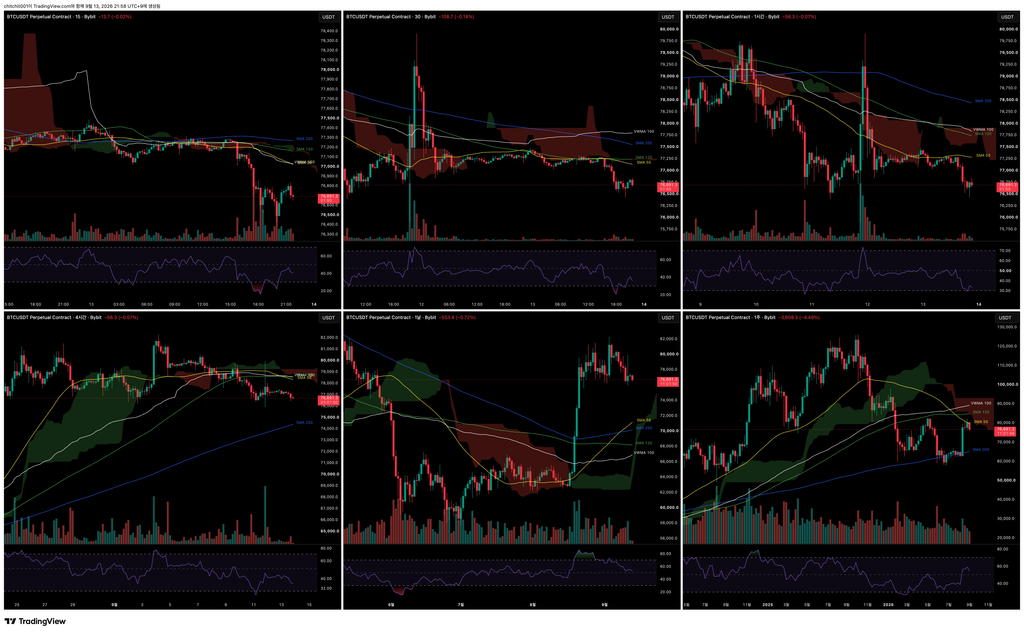
This is the comprehensive Bitcoin chart. From the upper left in a Z-shaped order, the timeframes are the 15-minute, 30-minute, 1-hour, 4-hour, daily, and weekly charts.
- Look at the weekly chart. After the sharp rise about one month ago, Bitcoin has been moving sideways for a full month. This week, it is showing a large decline. The reason I have not been writing much recently is that I experienced failure after entering positions too hastily in this sideways market. The current market is difficult to predict, and it feels like the kind of market that can easily absorb money from non-professional retail traders like me.
- On the daily chart, the candles are forming an inverse W pattern, while RSI continues to decline. It looks somewhat like bearish divergence. Overall, the direction seems to be leaning downward. It would be better if volume returned to the level seen during the rally one month ago, but volume has not come back either. In other words, this is truly a lifeless market.
- In this kind of market, large players could suddenly create a rally so fast that retail traders cannot even approach it. But that does not mean I should enter a position blindly. I need to reduce the probability of failure. Success is something that comes only after that.
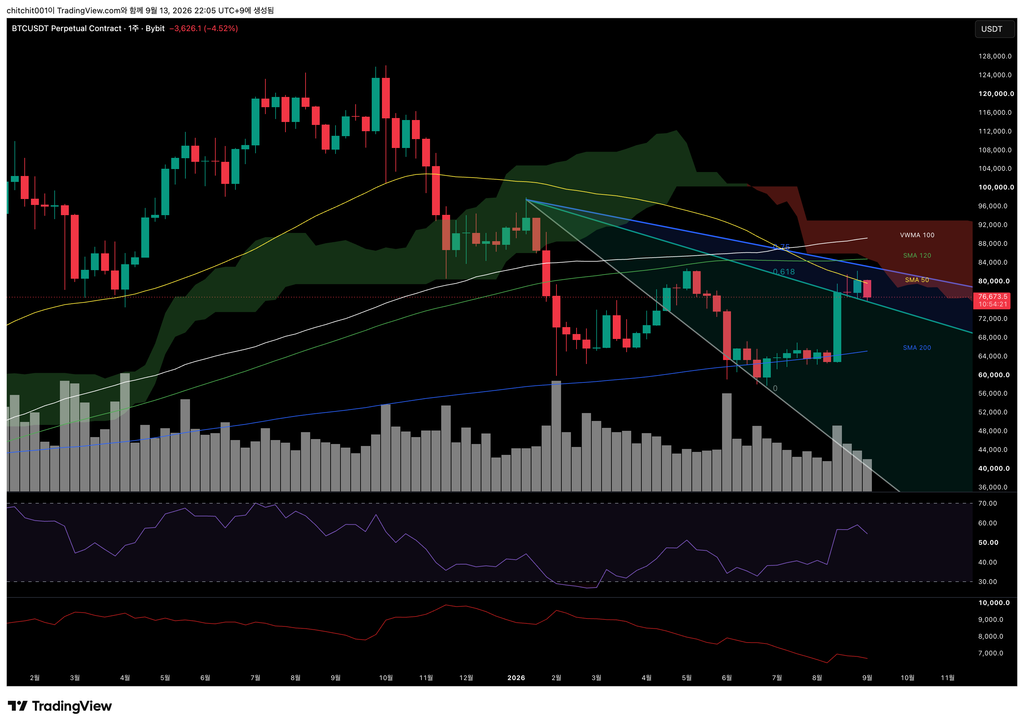
[Weekly Chart]
- Bitcoin failed to break cleanly above the previous high and is now undergoing a large correction again.It had moved above the 0.618 area of the speed fan, but has now come back to touch it again. Since this is a downward speed fan, touching it again can also mean that price is more likely to choose the downside direction.
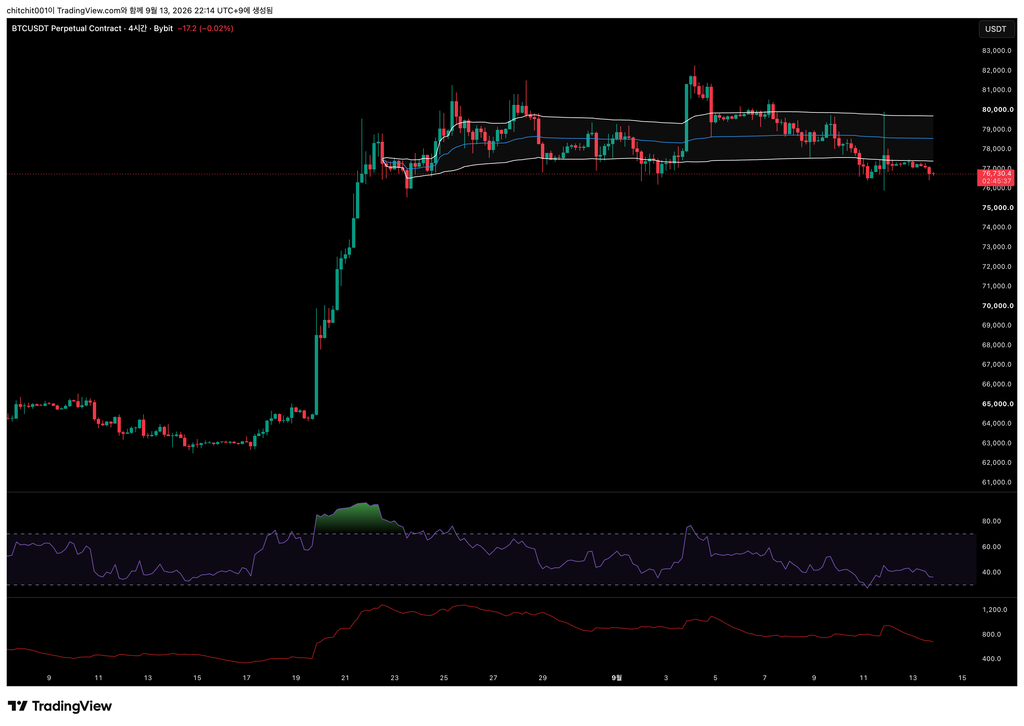
[4-Hour Chart]
- The Anchored VWAP has also broken below its lower band. The situation does not look particularly good.
[Ethereum, ETHUSDT.P]
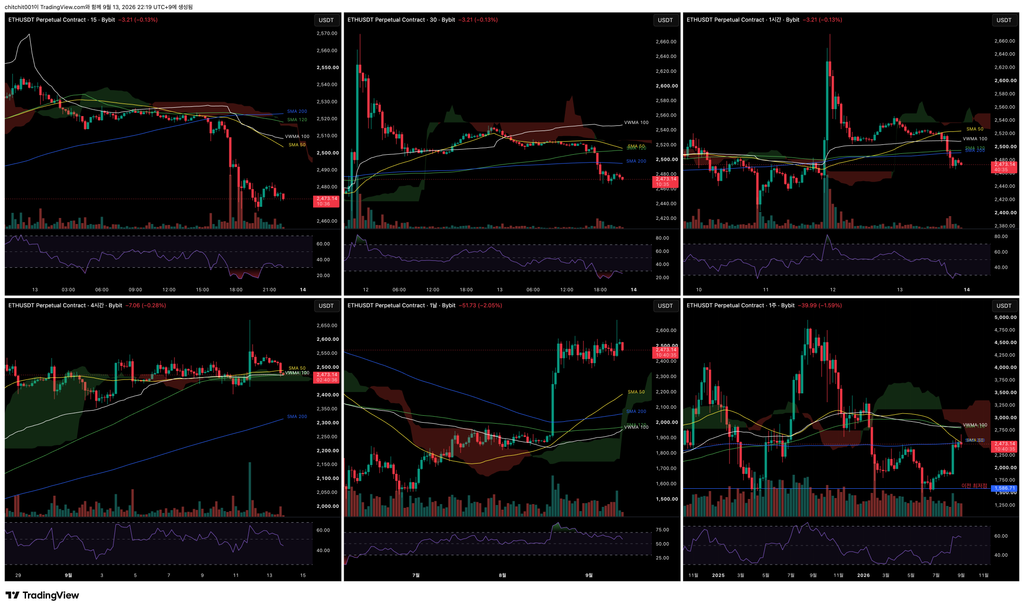
This is the comprehensive Ethereum chart.
- On the weekly chart, Ethereum still has not been able to move above the SMA 200. This is the minimum line it needs to break, so struggling even here does not look very positive. For now, Ethereum needs to break above the SMA 200 before I can expect further upside.
- On the daily chart as well, price is moving sideways while RSI is falling. For now, downside pressure is still stronger.
Statistically, September and October have often been weak months. This year, even during the summer period when an upward move could have been expected, the market moved sideways or declined. If September and October also follow the old pattern and move lower, it may become a truly dull market. I will keep watching and write again when a meaningful move appears.