This post is a personal investment journal based on my own market study and observations. It is not financial advice or a recommendation to buy or sell any asset. Each investor is responsible for their own investment decisions, so please make careful decisions based on your own judgment and risk tolerance.
[Bitcoin, BTCUSDT.P]
[4-Hour Chart]
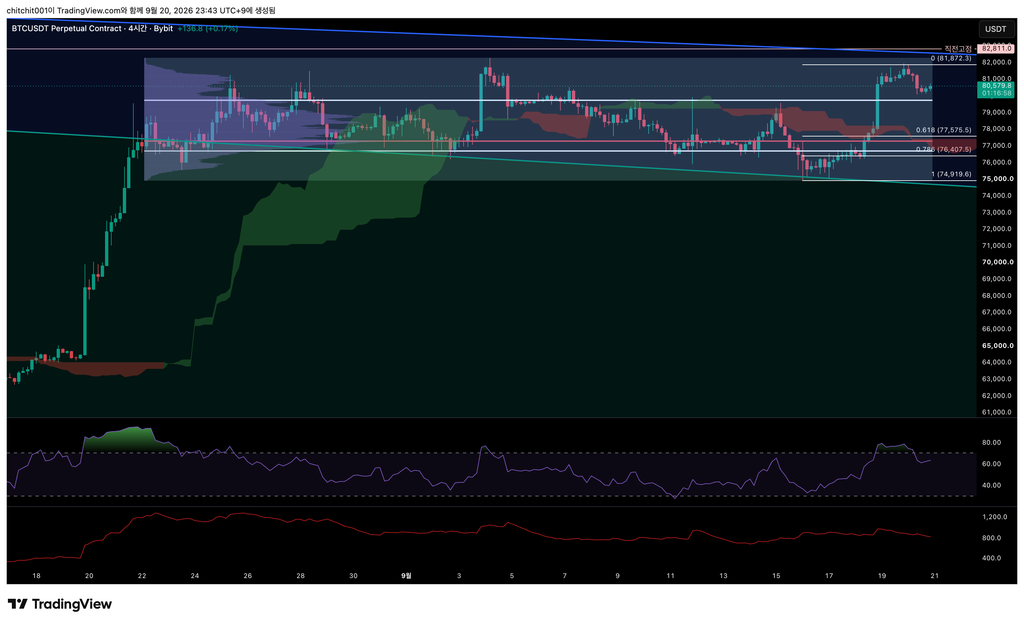
- Bitcoin began to decline last night. Fortunately, it held above the VAH of the consolidation range and is now showing signs of a rebound.
- My existing position has not been closed, so I am still holding it.
[1-Hour Chart]
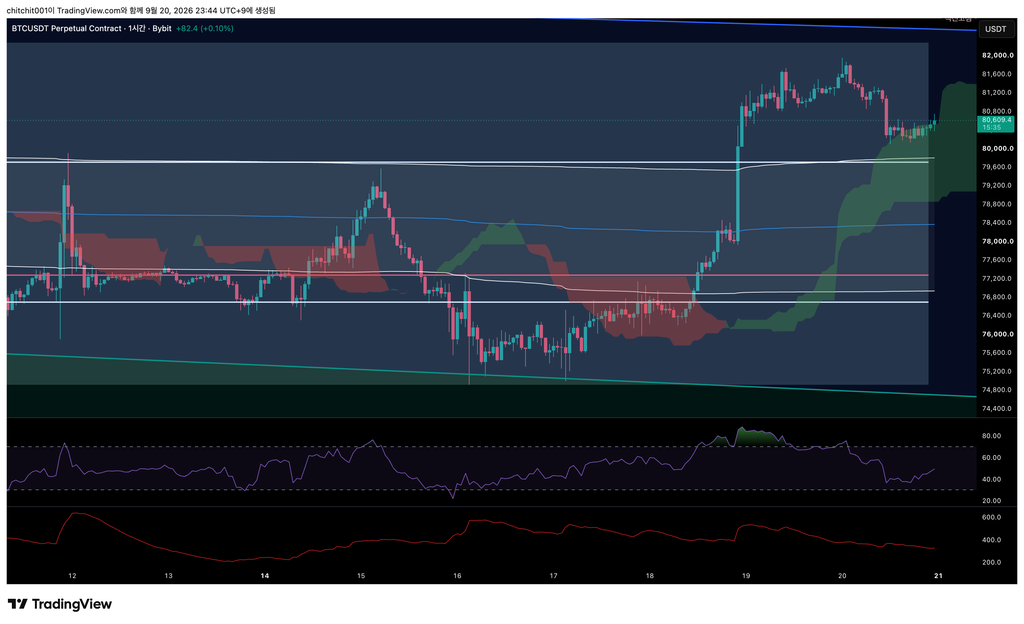
- The RSI on the 1-hour chart has cooled off from overbought conditions and is now beginning to rise again. There is also a substantial bullish Ichimoku cloud ahead. For now, I plan to continue holding my current position.
[Ethereum, ETHUSDT.P]
[Weekly Chart]
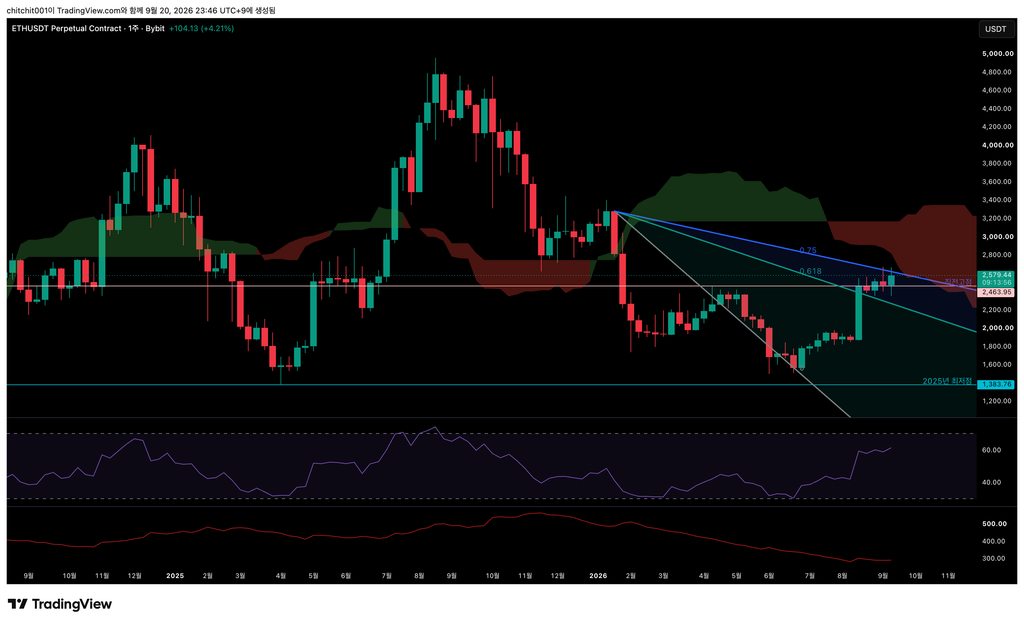
- The 0.75 level of the Speed Fan and the previous high are converging to form a symmetrical triangle.
- I expect price to break out in either direction soon.
[4-Hour Chart]
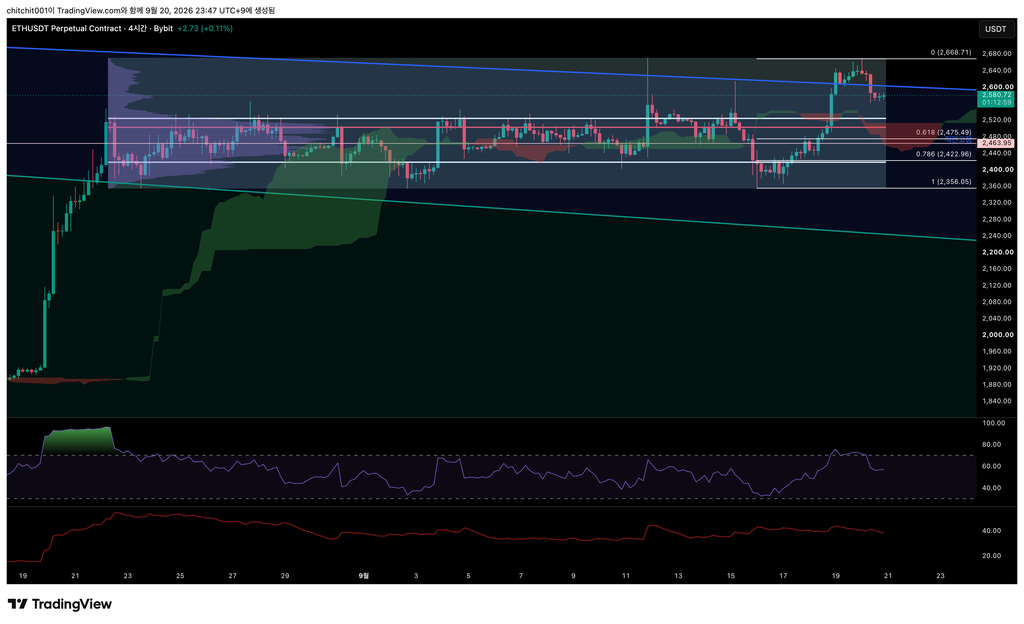
- I entered a long position while price was above the 0.75 level of the Speed Fan, with a tight stop-loss in place, but the stop-loss was triggered.
- I plan to enter another long position if price moves back above the 0.75 level. Once again, I will use the 0.75 level as my stop-loss reference.
- I am also considering an entry around the 0.618 Fibonacci retracement level, based on the low and high of the previous rally. The VAL of the consolidation range lies just below it, providing a clear level for placing a stop-loss.
- To sum up my plan: if price rises from here, I will look for an entry at the 0.75 level of the Speed Fan. If it continues to fall, I will look for an entry near the 0.618 Fibonacci retracement level.