This post is a personal investment journal based on my own market study and observations. It is not financial advice or a recommendation to buy or sell any asset. Each investor is responsible for their own investment decisions, so please make careful decisions based on your own judgment and risk tolerance.
[Bitcoin, BTCUSDT.P]
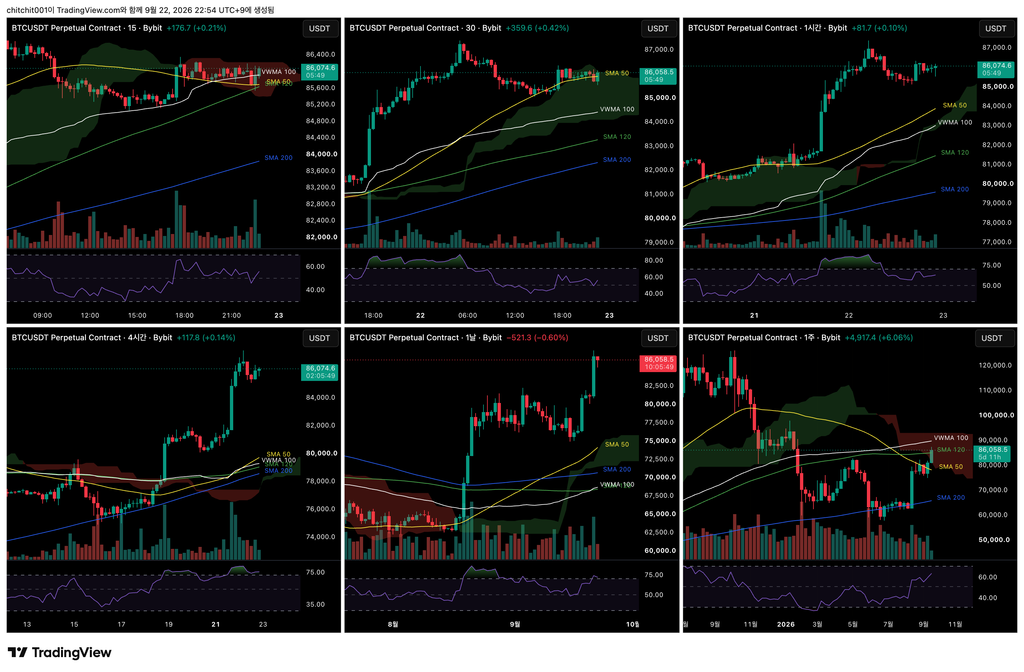
This is a multi-timeframe overview of Bitcoin. Starting from the upper left and following a Z-shaped order, the charts show the 15-minute, 30-minute, 1-hour, 4-hour, daily, and weekly timeframes.
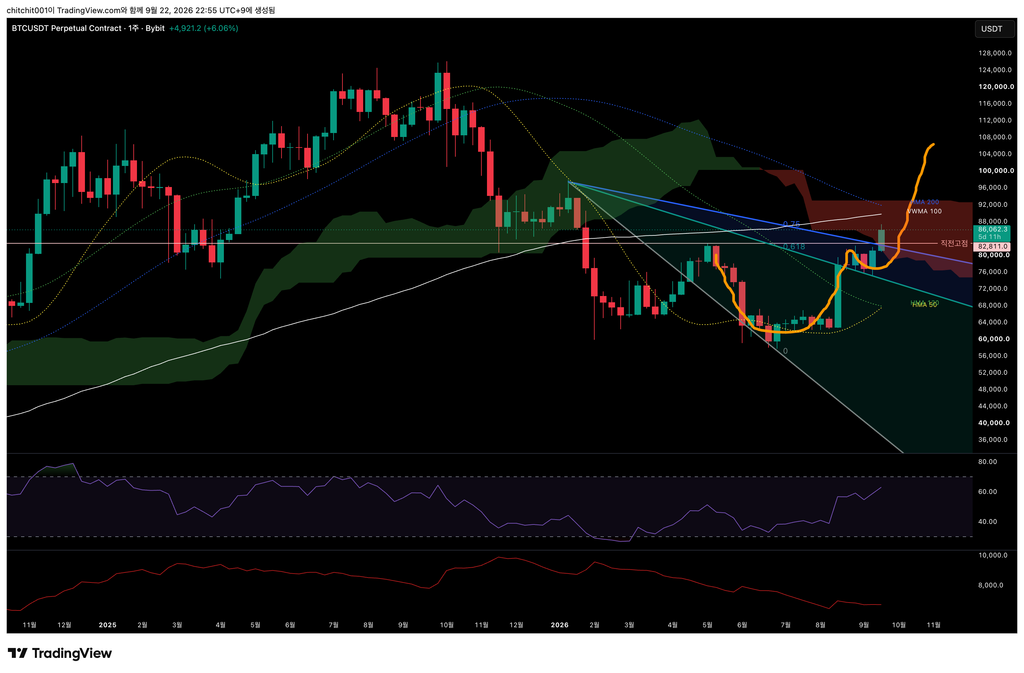
[Weekly Chart]
- The cup-and-handle pattern is now clearly visible. This week’s gain has already matched last week’s.
- Price has also broken above the 0.75 level of the Speed Fan. In my reading of the chart, that makes a move toward the previous high more likely, though I would not treat 75% as a measured probability. After this week’s candle closes, I may need to redraw the Speed Fan.
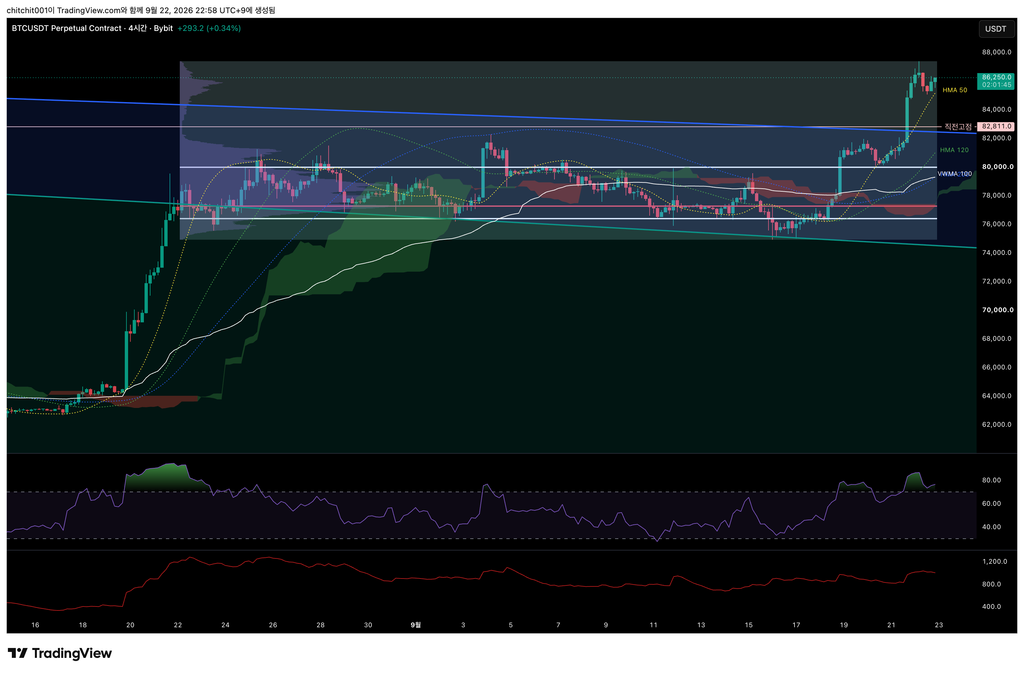
[4-Hour Chart]
- Price has moved well above the volume profile’s VAH and has broken through the previous high. If I did not already have a position, I would watch from the sidelines rather than chase the move.
[Ethereum, ETHUSDT.P]
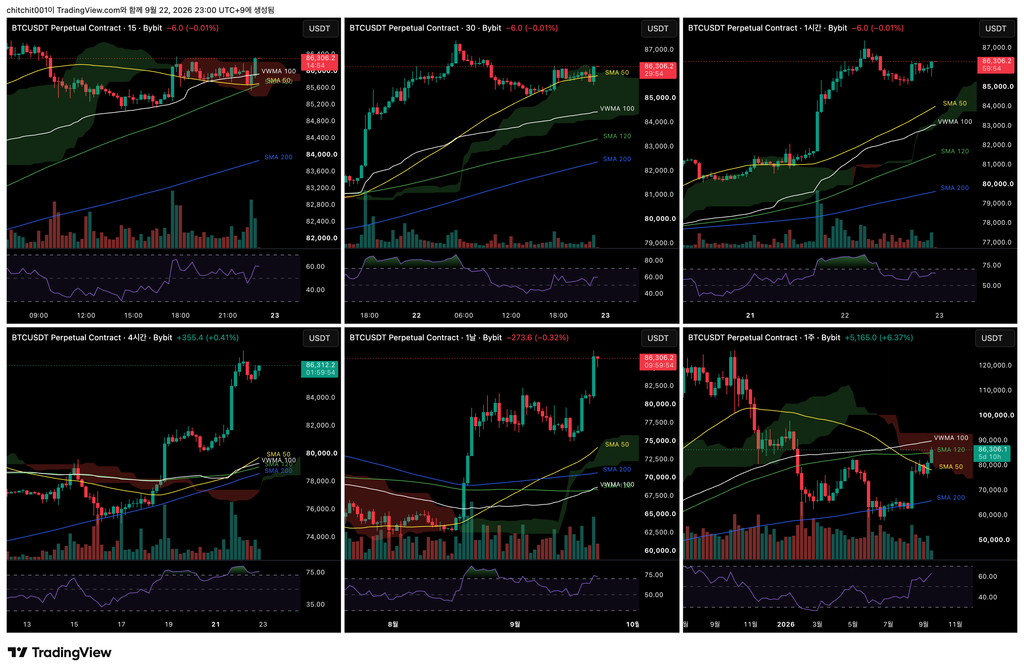
This is a multi-timeframe overview of Ethereum.
[Weekly Chart]
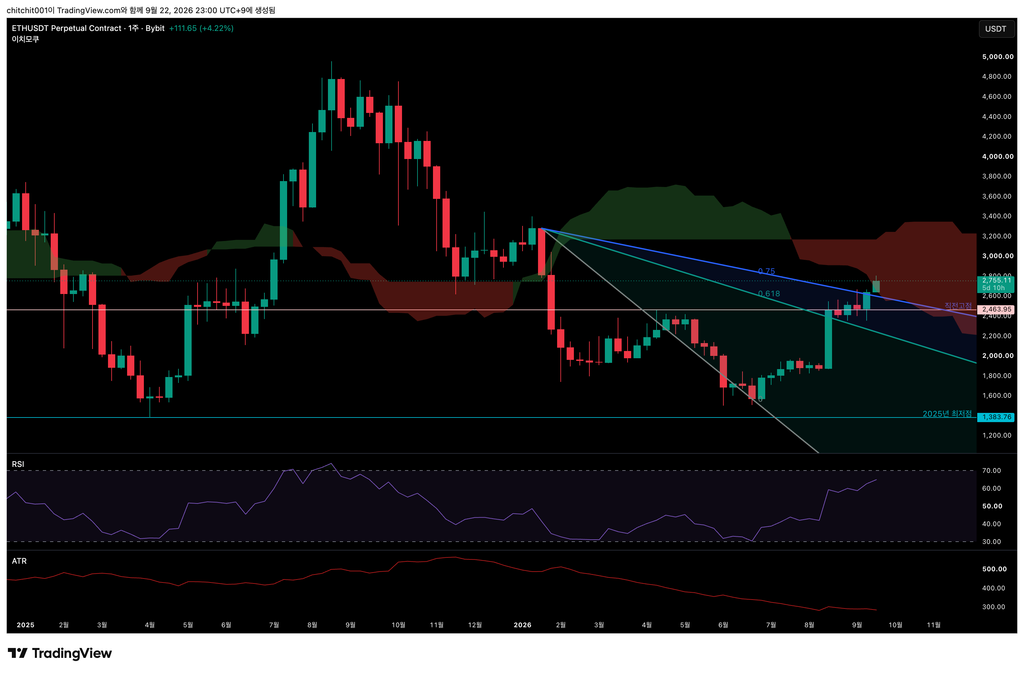
- Ethereum has also moved above the 0.75 level of the Speed Fan.
- A thick bearish Ichimoku cloud lies ahead. Bitcoin has begun testing its cloud, while Ethereum is only now approaching its own. I would like to see a decisive move through it.
[4-Hour Chart]
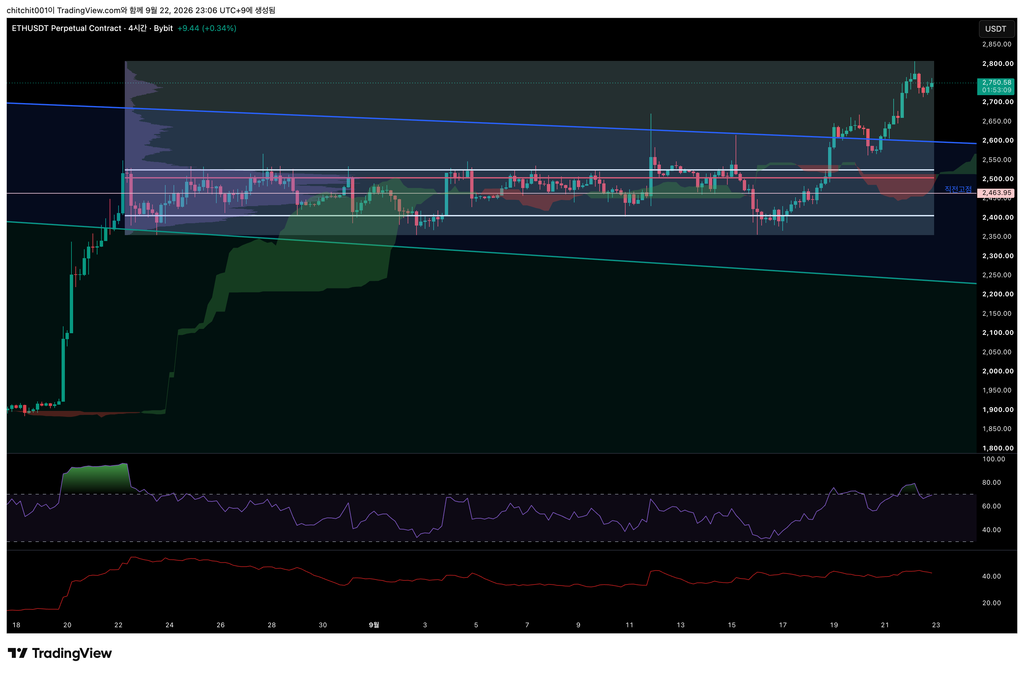
- In my previous post, I wrote that I would consider an entry if price broke above the 0.75 level of the Speed Fan, with a tight stop-loss. That trade worked out.
- Price has risen by more than 5%. For my position, I think it makes sense to keep holding and see how far the move goes. With crypto markets broadly rising, I am considering moving my stop-loss to breakeven and giving the position room to run.