This post is a personal investment journal based on my own market study and observations. It is not financial advice or a recommendation to buy or sell any asset. Each investor is responsible for their own investment decisions, so please make careful decisions based on your own judgment and risk tolerance.
[Bitcoin, BTCUSDT.P]
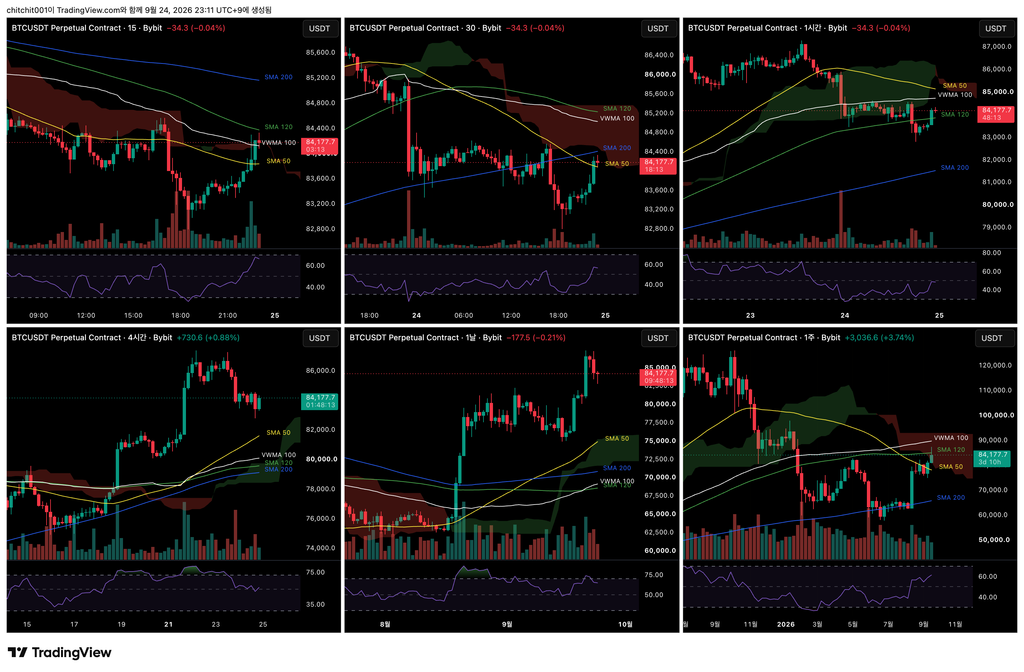
This is a multi-timeframe overview of Bitcoin. Starting from the upper left and following a Z-shaped order, the charts show the 15-minute, 30-minute, 1-hour, 4-hour, daily, and weekly timeframes.
- On the weekly chart, price has moved above the SMA 50. It is now facing resistance at the SMA 120, with a thick bearish Ichimoku cloud lying ahead. From here, price may either pull back from resistance or break through it decisively.
- The daily chart has formed three consecutive bearish candles. On the 4-hour chart, price consolidated and surged, consolidated and surged again, and is now moving sideways after a decline. If bullish momentum remains strong, this consolidation may be absorbing supply before another move higher. If momentum is weak, however, another sharp decline could follow. With no clear increase in trading volume, the situation remains uncertain, so I do not think this is the right time for me to enter a position.
[Weekly Chart]
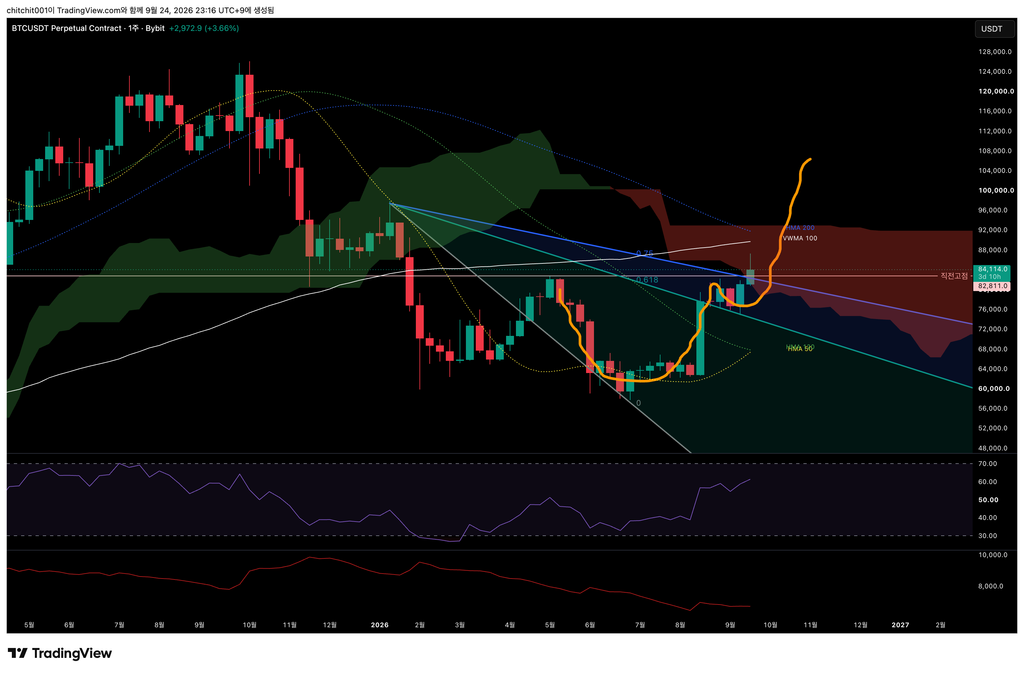
- This week’s candle has given back roughly half of its gains and now has a long upper wick. Price has entered the bearish Ichimoku cloud, making the market’s movement from Friday through Sunday particularly important.
- The upcoming U.S.-China summit could also generate news that causes substantial volatility in the crypto market. If I were to enter a position at this point, I would aim for a quick outcome, whether that means taking profit or cutting the loss.
[Daily Chart]
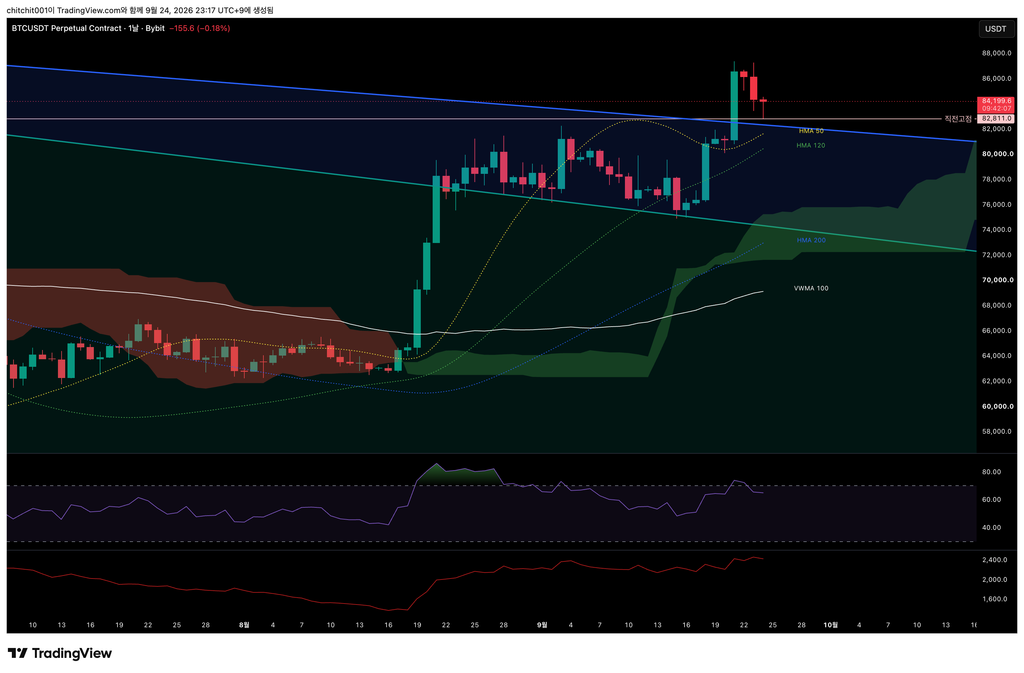
- Price found support precisely at the previous high and formed a long lower wick. This also suggests that market participants are watching this level closely.
- Because price previously broke decisively above the 0.75 level of the descending Speed Fan in a single move, it may return to test that level as support.
- If I missed the first test, I may consider entering on a second test and use a break below the Speed Fan as the basis for my stop-loss.
- However, as explained above, several factors on the longer-term charts could act as resistance. If the setup begins to look invalid, I would exit quickly.
[4-Hour Chart]
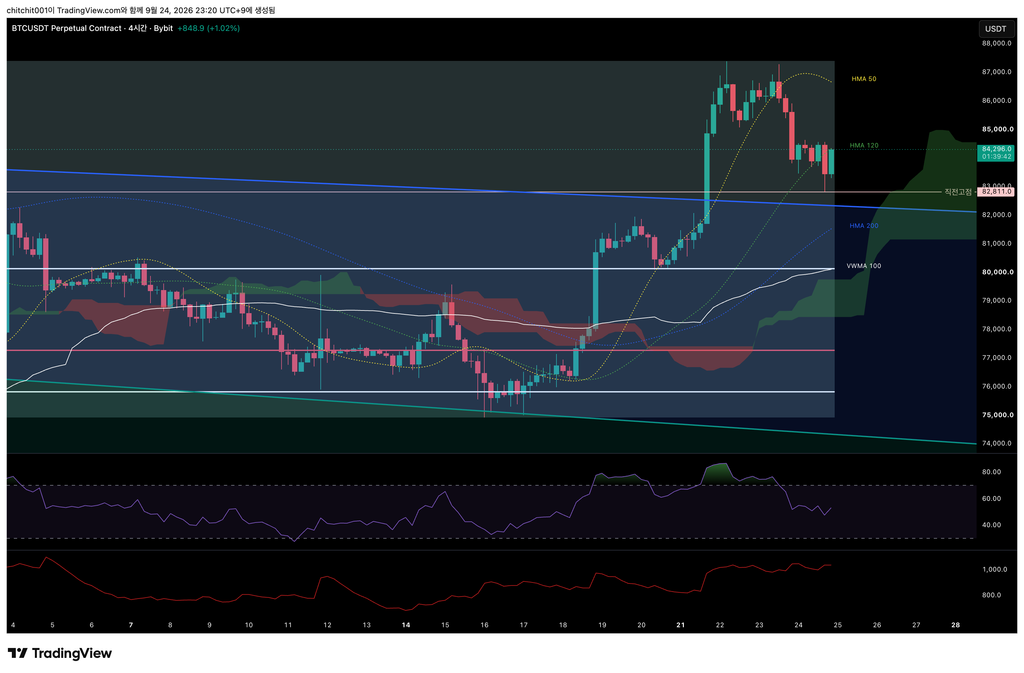
- The volume profile levels are far below the current price, so they are not particularly relevant right now. Meanwhile, the RSI is gradually cooling, bringing the market closer to a level where I may feel more comfortable considering a long position.
[Ethereum, ETHUSDT.P]
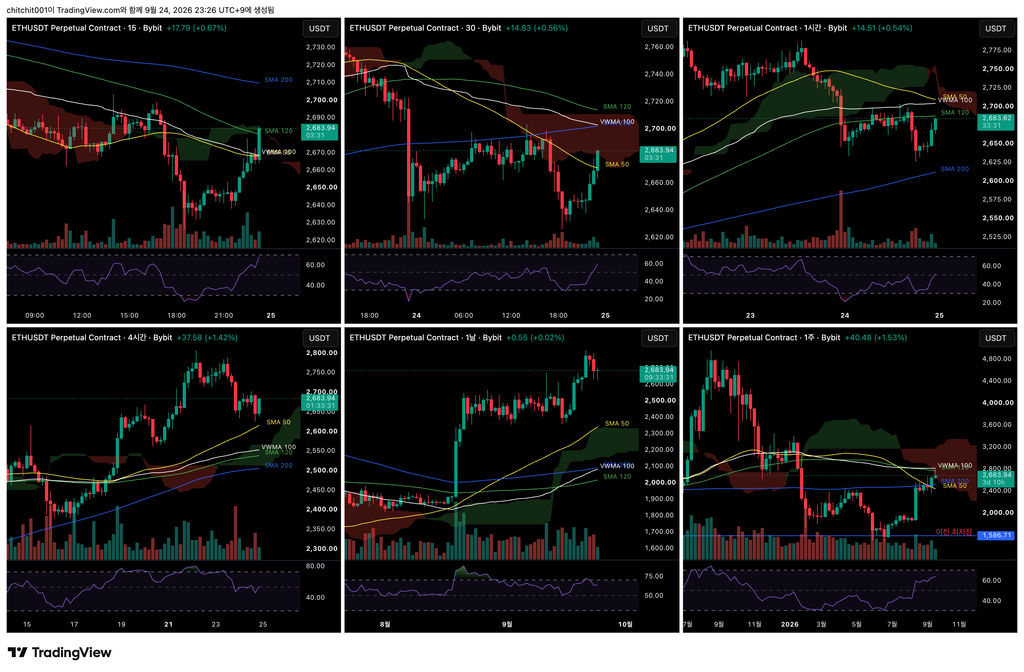
This is a multi-timeframe overview of Ethereum.
- On the weekly chart, the VWMA 100 and SMA 120 are acting as resistance. With a substantial bearish Ichimoku cloud ahead and two moving averages creating additional resistance, the path upward does not look easy.
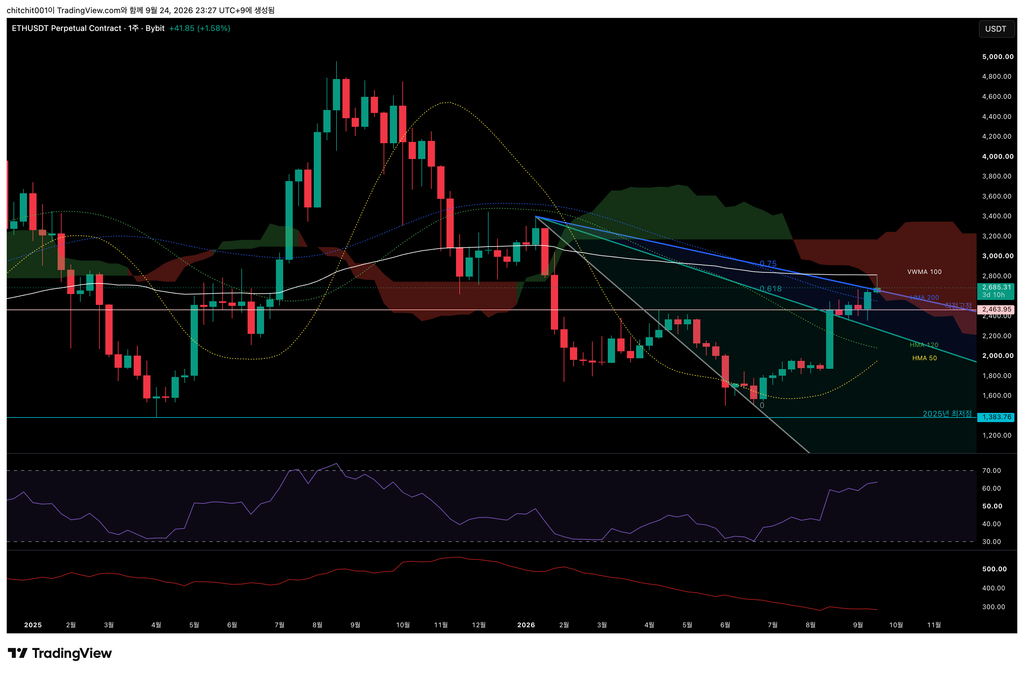
[Weekly Chart]
- The weekly candle has also given back more than half of its gains from the high. It is currently in an uncertain position.
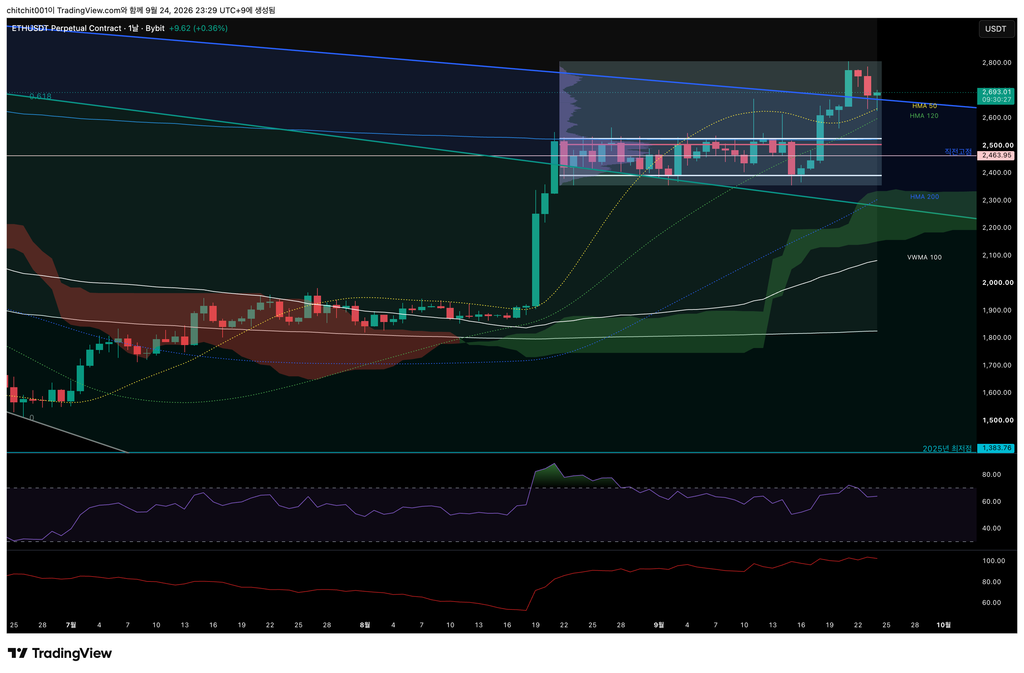
[Daily Chart]
- As with Bitcoin, Ethereum is consolidating around the 0.75 level of the Speed Fan.
- After two consecutive bearish candles, today’s candle has turned bullish. We will have to watch whether the recovery continues from here.
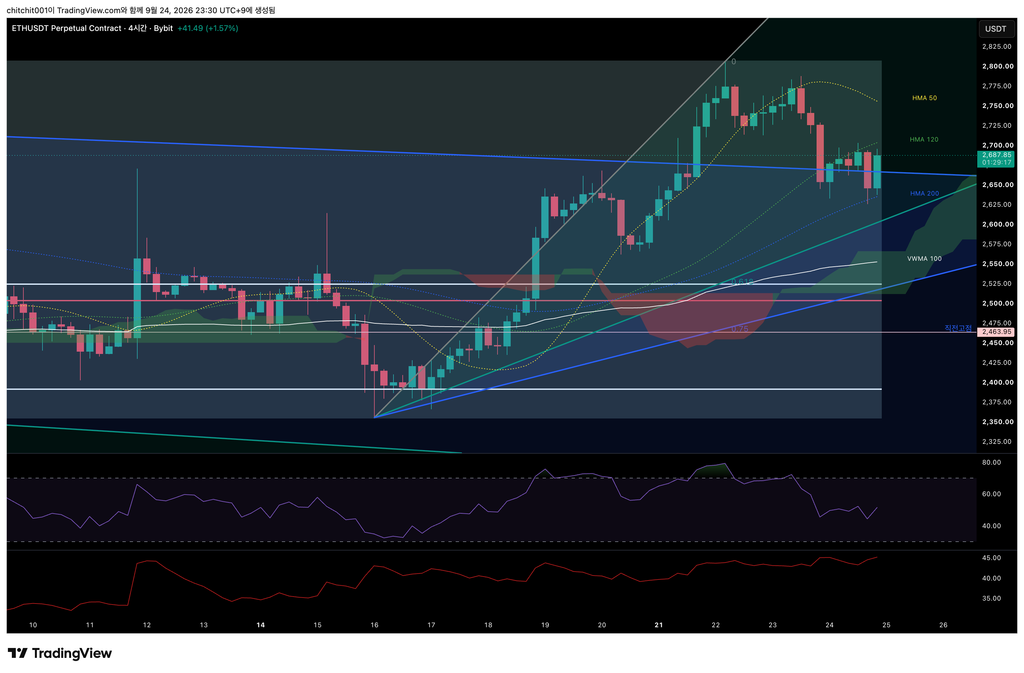
[4-Hour Chart]
- There is nothing particularly notable on this timeframe. A few days ago, I wrote that I would consider a long entry when price moved above the Speed Fan. It subsequently rallied before returning to its starting point.
- Price is now testing the Speed Fan once again. If I did not already have a position, I might consider another entry around this level.
- However, the longer-term timeframes remain uncertain, as noted above. I would keep that in mind and define a clear stop-loss level before entering.