This post is simply a personal investment journal based on my own market observations. Please do not take it as investment advice or follow it blindly. Every investment decision is your own responsibility, so please invest carefully and I sincerely hope your decisions lead to successful outcomes.
[Bitcoin, BTCUSDT.P]
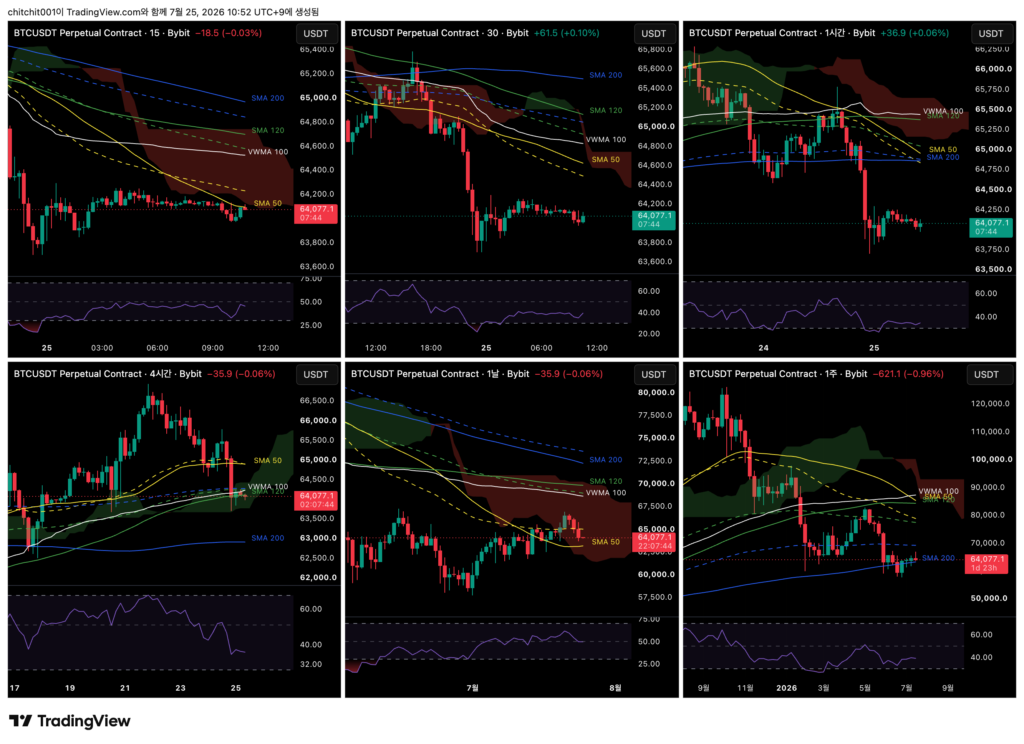
This is the comprehensive Bitcoin chart. From the upper left in a Z-shaped order, the timeframes are the 15-minute, 30-minute, 1-hour, 4-hour, daily, and weekly charts.

[Weekly Chart]
From a long-term perspective, the current position is ambiguous for making an investment decision. It seems better to watch the flow when the candle reaches the center area of either the January or May volume zone, and then decide.
Bitcoin ultimately failed to break above the purple speed fan and is now pulling back. That means I need to view the market more conservatively again.
Price faced resistance around the center of the volume zone that began in January and moved lower. Now, I need to see whether it can receive support around the center of the volume zone that began in May.

[Daily Chart]
- Since Bitcoin had broken above the upper area of the sideways volume zone, the VAH, I had some hope that it could move higher. But after four consecutive days of decline, that hope has faded.
- It is also inside a thick bearish Ichimoku cloud, so it looks difficult for price to gain strong upward momentum.
- For now, I think it is better to watch and wait until the candle comes near a moving average or volume zone where support could form.

[4-Hour Chart]
- I had marked the yellow areas and mentioned that Bitcoin was continuing to receive support from the moving averages. Now, that trend has broken.
- The VWMA 100 area is also acting as resistance rather than support.
- It may still move higher from here, but based only on the chart, I think it is better to give more weight to the bearish view.

[1-Hour Chart]
- The candles are moving in an area without nearby moving averages, which makes analysis difficult.
- The moving averages are also preparing for a dead cross. Unless a dramatic rebound appears, I think it is better to prepare for downside.
[Ethereum, ETHUSDT.P]

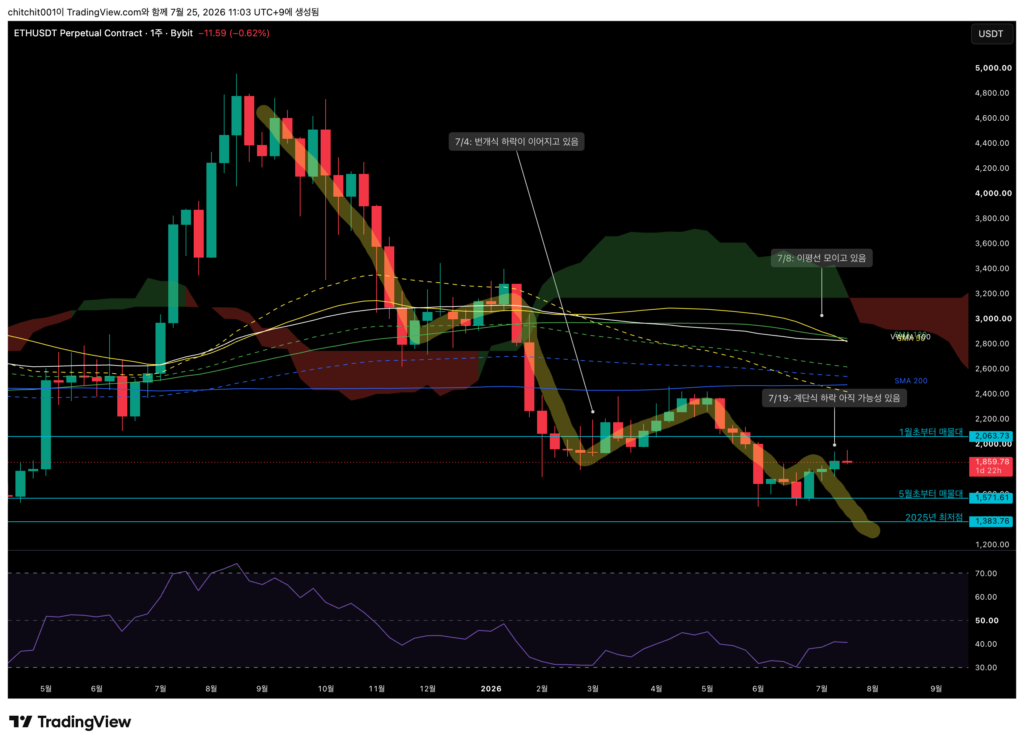
This is the comprehensive Ethereum chart.
[Weekly Chart]
- The flow this week and next week looks important. This week’s weekly candle is forming a bearish candle, so a step-like decline could begin again.

[Daily Chart]
- Ethereum is moving lower after facing resistance at the VWMA 100.
- It looked like Ethereum might break through the bearish Ichimoku cloud, but as expected, it failed to do so and is now declining.
- The current area does not offer any clear support or resistance to rely on, so I think this is a zone to simply observe.
[Daily Chart]
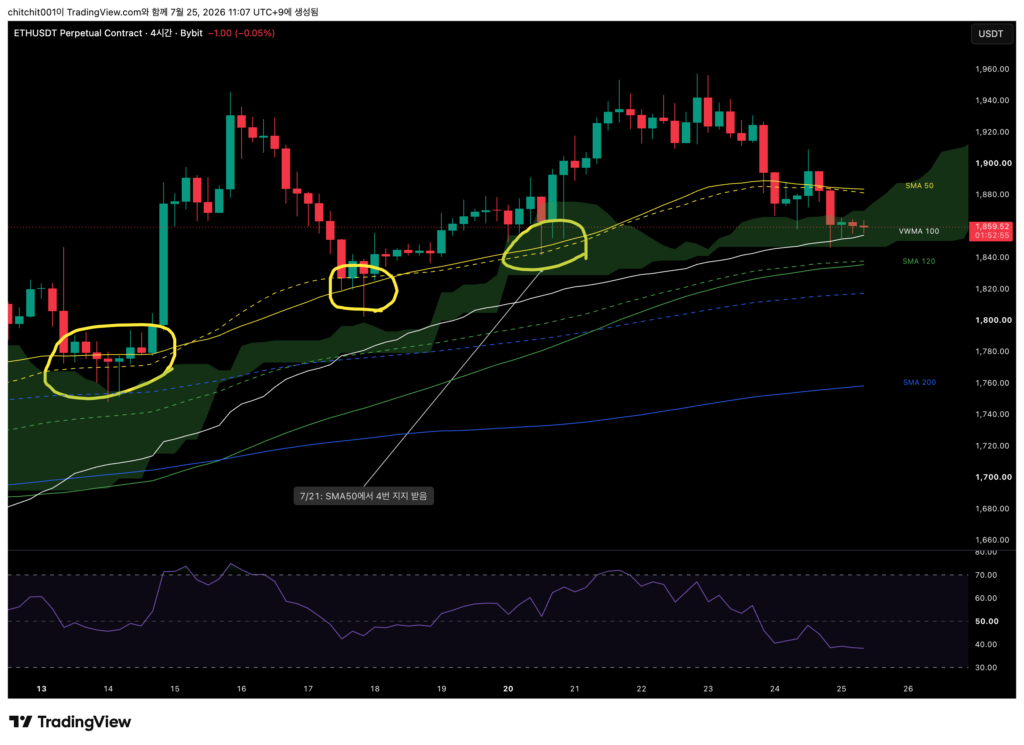
- Ethereum is moving lower after facing resistance at the VWMA 100.
- It looked like Ethereum might break through the bearish Ichimoku cloud, but as expected, it failed to do so and is now declining.
- The current area does not offer any clear support or resistance to rely on, so I think this is a zone to simply observe.

[1-Hour Chart]
- On the 4-hour chart, I mentioned that a buy setup could be considered.
- However, when looking at the longer timeframes and the 1-hour timeframe, there is still fear of downside, so the stop-loss line must be kept tight.