This post is simply a personal investment journal based on my own market observations. Please do not take it as investment advice or follow it blindly. Every investment decision is your own responsibility, so please invest carefully and I sincerely hope your decisions lead to successful outcomes.
[Bitcoin, BTCUSDT.P]
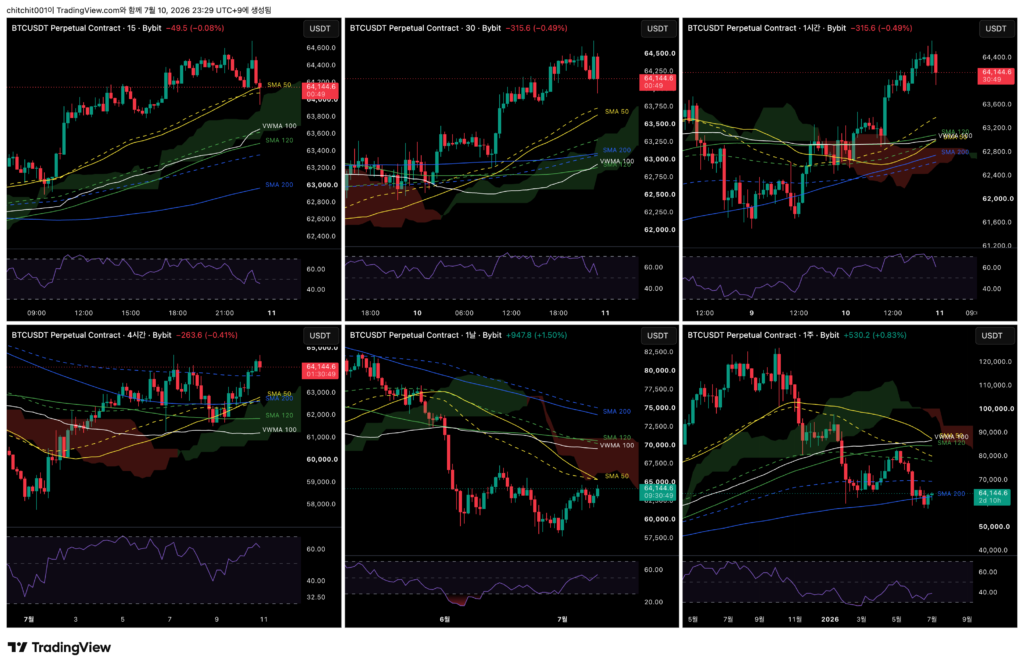
This is the comprehensive Bitcoin chart. From the upper left in a Z-shaped order, the timeframes are the 15-minute, 30-minute, 1-hour, 4-hour, daily, and weekly charts.
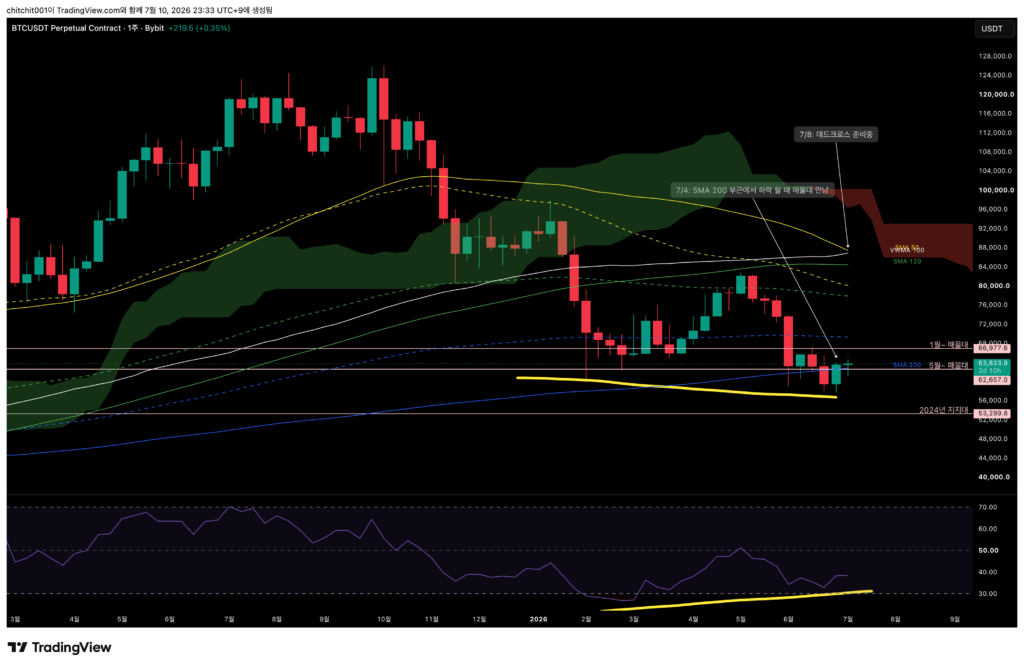
[Weekly Chart]
- Bitcoin has formed a doji candle.
- Since it rose sharply yesterday, seeing a doji candle today feels slightly uneasy. It would be good to see price move higher during the U.S. trading session.
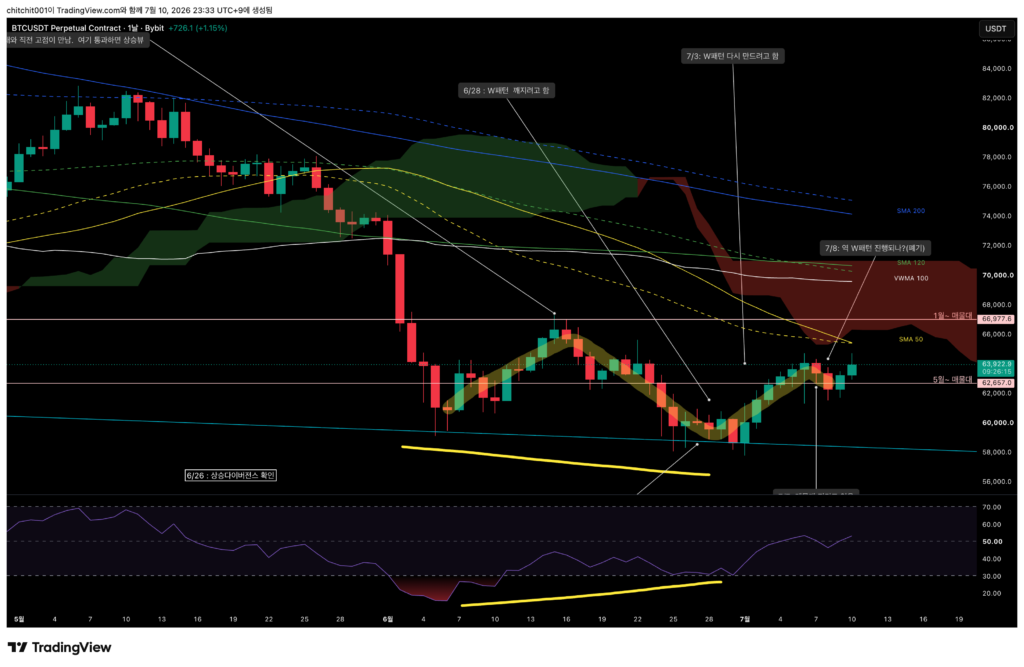
[Daily Chart]
- Yesterday, I drew the yellow line because I thought an inverse W pattern might be forming. So far, however, that does not seem to be the case.
- In other words, I think I need to approach the market with the possibility that it may move higher.
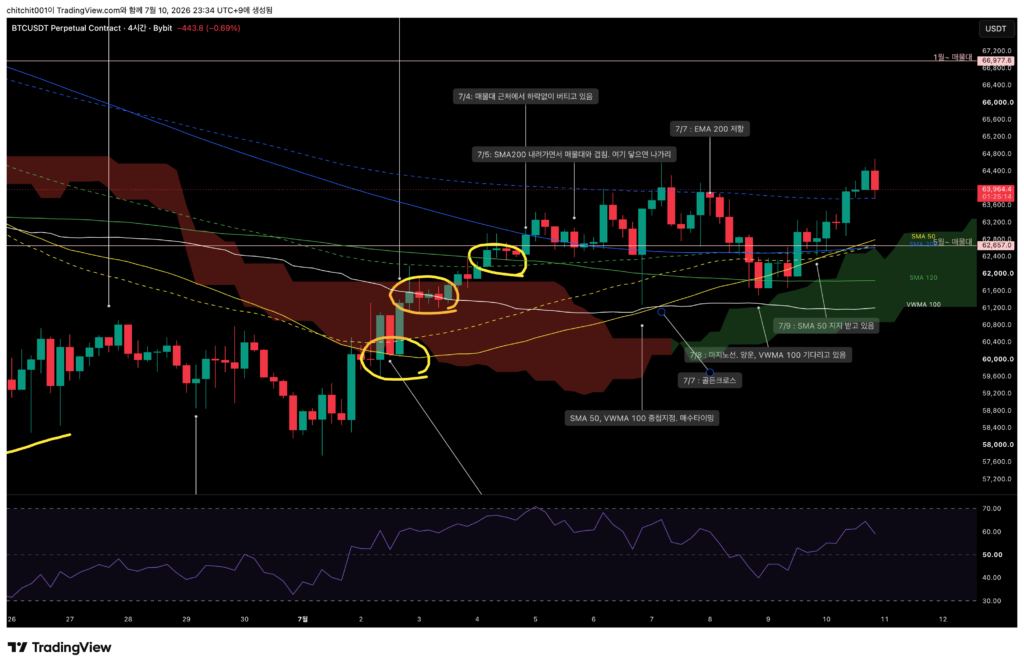
[4-Hour Chart]
- Bitcoin moved higher while receiving support from the SMA 50, and then rose sharply away from the moving average.
- Since the move has already left, I need to wait for a pullback. When there is confidence that the longer timeframe has turned upward, support from this kind of moving average can be a point where I should be willing to enter more decisively.
- For now, though, I still do not have strong conviction that the longer timeframe is clearly in an uptrend, so I think it is better to approach carefully.
[1-Hour Chart]
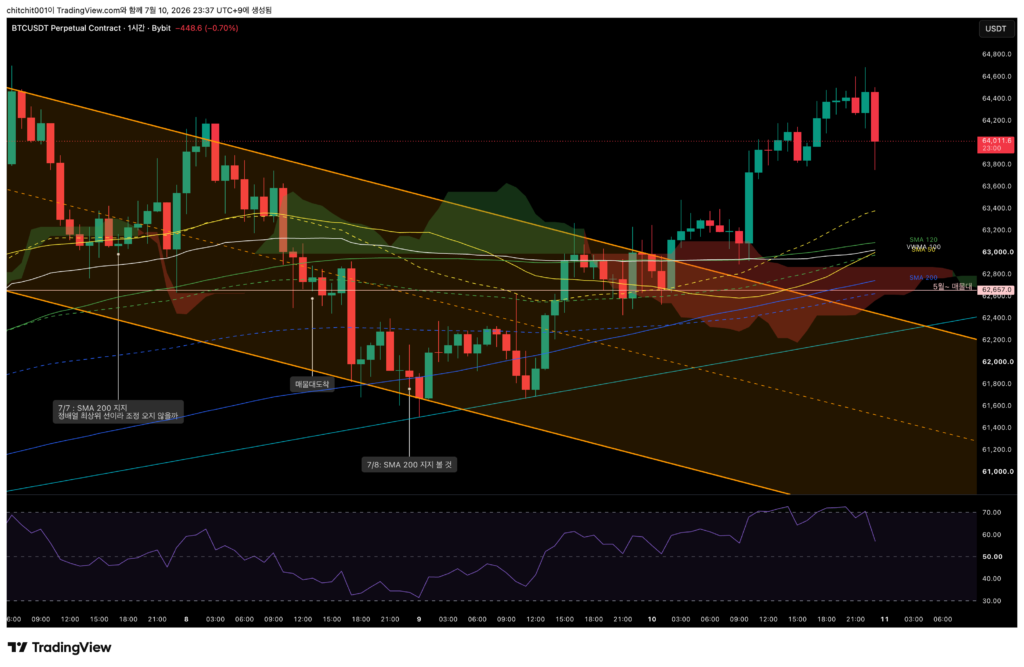
- The moving averages are converging. The candles have already moved up sharply, and the RSI has also moved above 70.
- A correction may occur, and at the time of writing, a pullback is already underway. It may be possible to look for an entry point on an even shorter timeframe. However, since candles tend to move back toward the moving averages, I think there may be a bit more correction ahead.
[Ethereum, ETHUSDT.P]

This is the comprehensive Ethereum chart.

[Weekly Chart]
- Like Bitcoin, Ethereum has also formed a doji candle.
- For the lightning-shaped downward pattern to break, a sharp move upward would be needed. If a bearish candle appears after this doji, the dull trend may continue.
[Daily Chart]
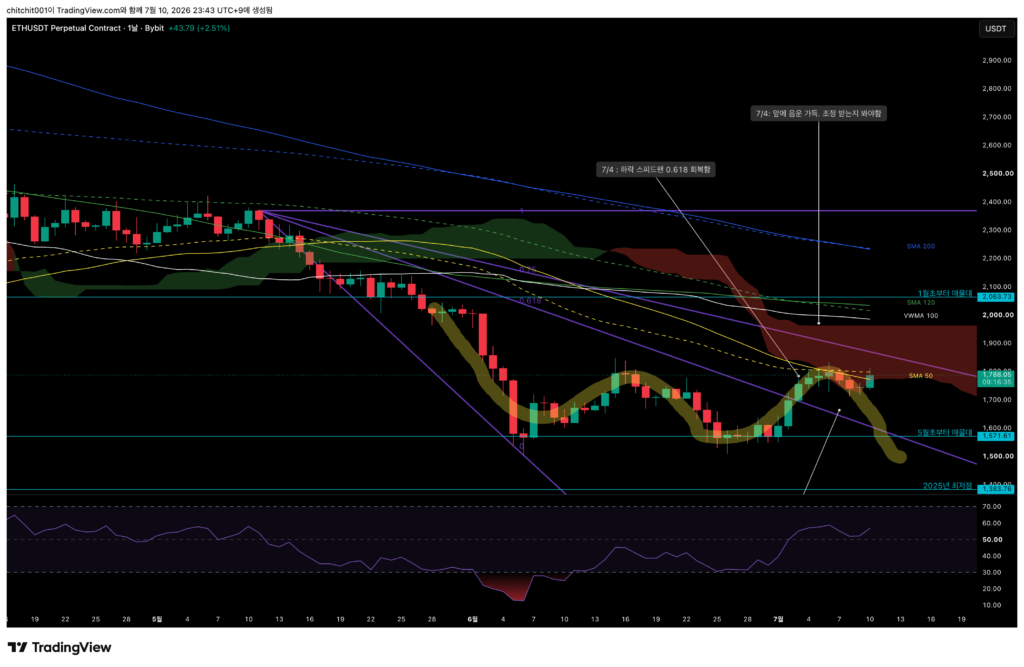
- Ethereum has still not been able to move away from resistance at the SMA 50. I need to watch today’s close carefully. If the candle can close above the SMA 50, that would at least provide some relief.
[4-Hour Chart]
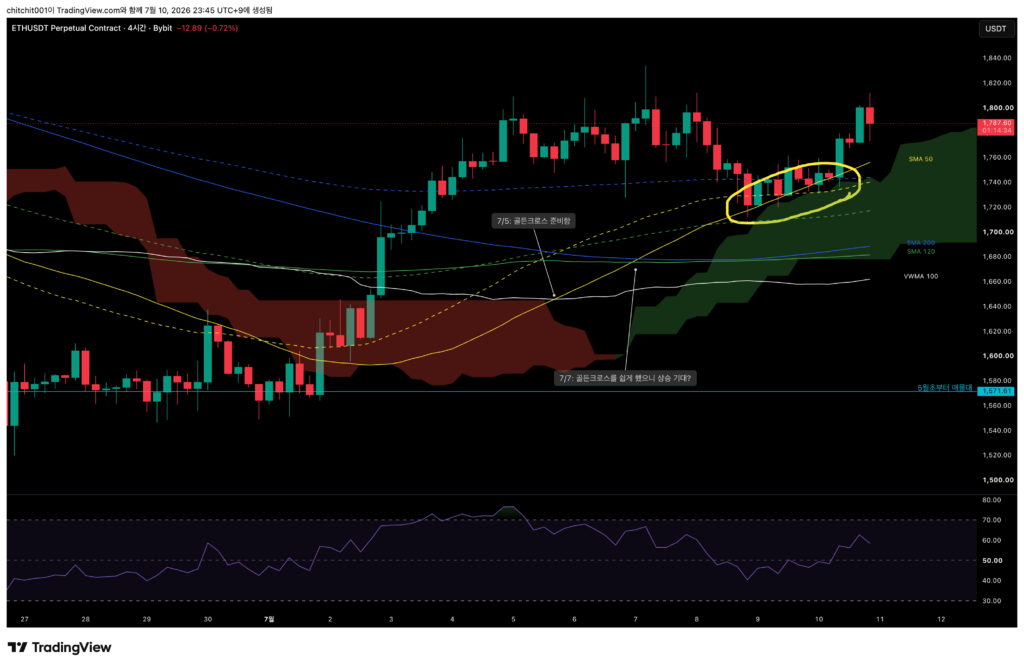
- Ethereum received support from the SMA 50 for about two days. In hindsight, that should have been viewed as an opportunity.
- At the moment, there is now a gap between the candles and the moving averages, so looking for a buying opportunity on a pullback may also be reasonable.
[1-Hour Chart]
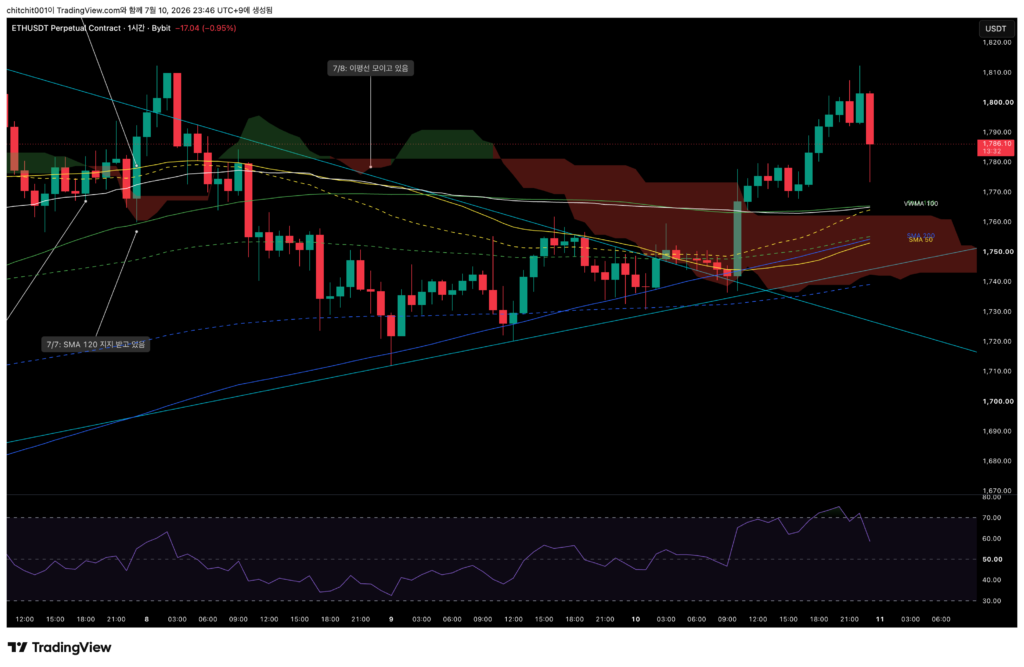
- Ethereum has broken through the bearish candle in one move, and the flow itself looks good.
- However, at the time of writing, it is forming a large bearish candle, so this is a point where I need to stay alert.
- The VWMA 100 and SMA 120 are moving almost as one, so if price comes down to that area, it could become a fairly meaningful support level.