This post is a personal investment journal based on my own market study and observations. It is not financial advice or a recommendation to buy or sell any asset. Each investor is responsible for their own investment decisions, so please make careful decisions based on your own judgment and risk tolerance.
[Bitcoin, BTCUSDT.P]
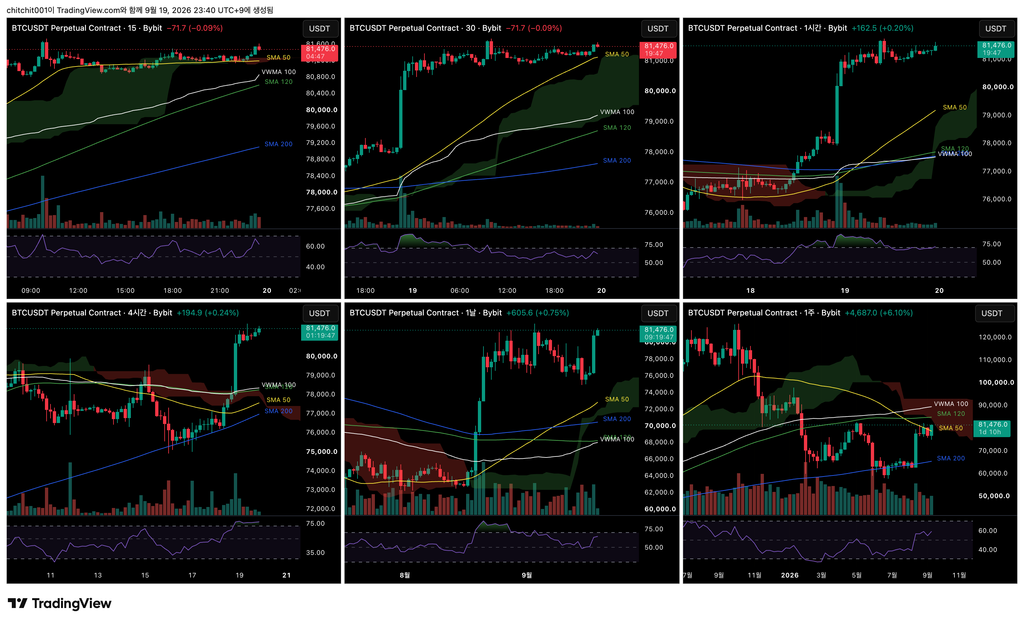
This is a multi-timeframe overview of Bitcoin. Starting from the upper left and following a Z-shaped order, the charts show the 15-minute, 30-minute, 1-hour, 4-hour, daily, and weekly timeframes.
- There is just one thing I would like to focus on here: the weekly trend. Bitcoin is forming a strong bullish candle that could make up for the past month of sideways movement.
- The current uncertainty in the geopolitical landscape could pose a risk. However, if Bitcoin holds up well through tomorrow, we should have a much clearer basis for a positive outlook.
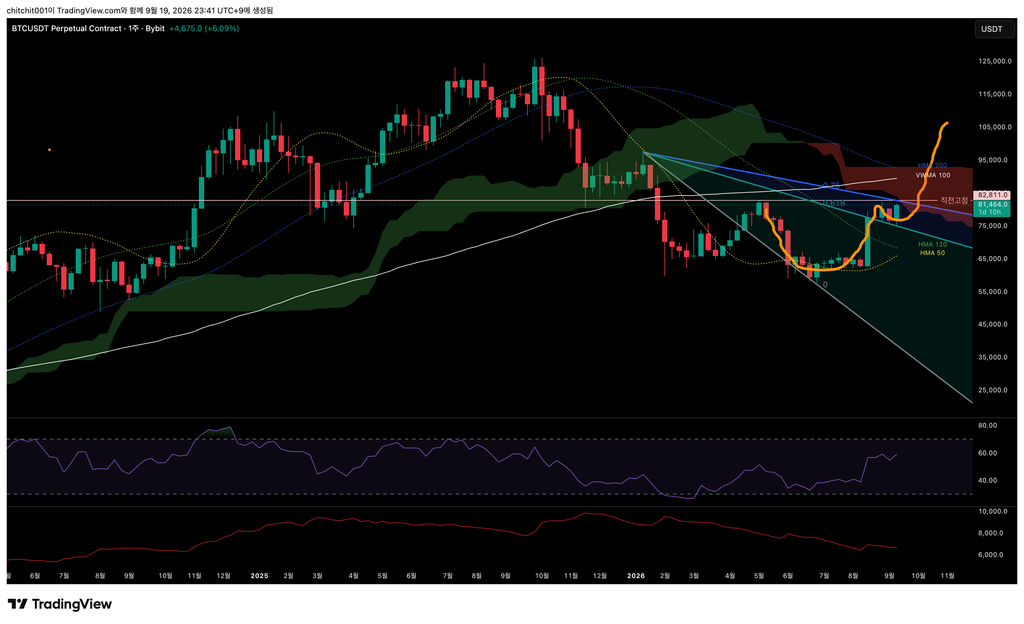
[Weekly Chart]
- Yesterday, I mentioned a potential cup-and-handle pattern. The chart now appears to be developing in that direction.
- The overall picture remains positive so far. As I mentioned yesterday, we need to watch the previous high and the 0.75 level of the Speed Fan closely to see whether price encounters resistance there.
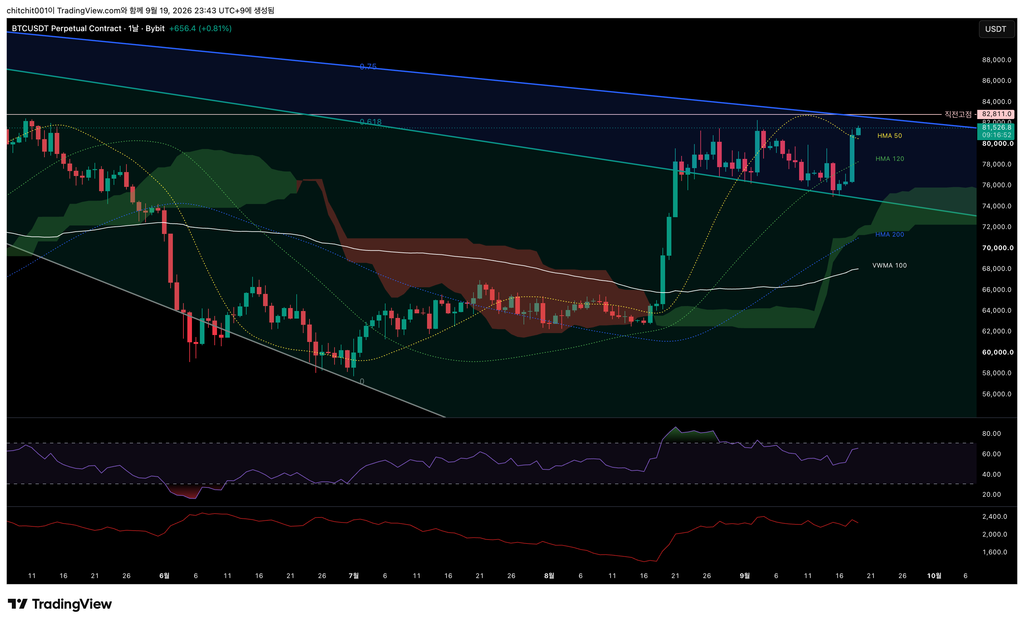
[Daily Chart]
- Let’s look at a shorter timeframe. Price is almost there, isn’t it? If this bullish pattern continues, it could reach the level mentioned above within the next day or two.
- I have already taken profit on half of my position, so I plan to hold the rest for now. If price falls by around 1% after reaching that level, I intend to close the remainder of my position and take the full profit.
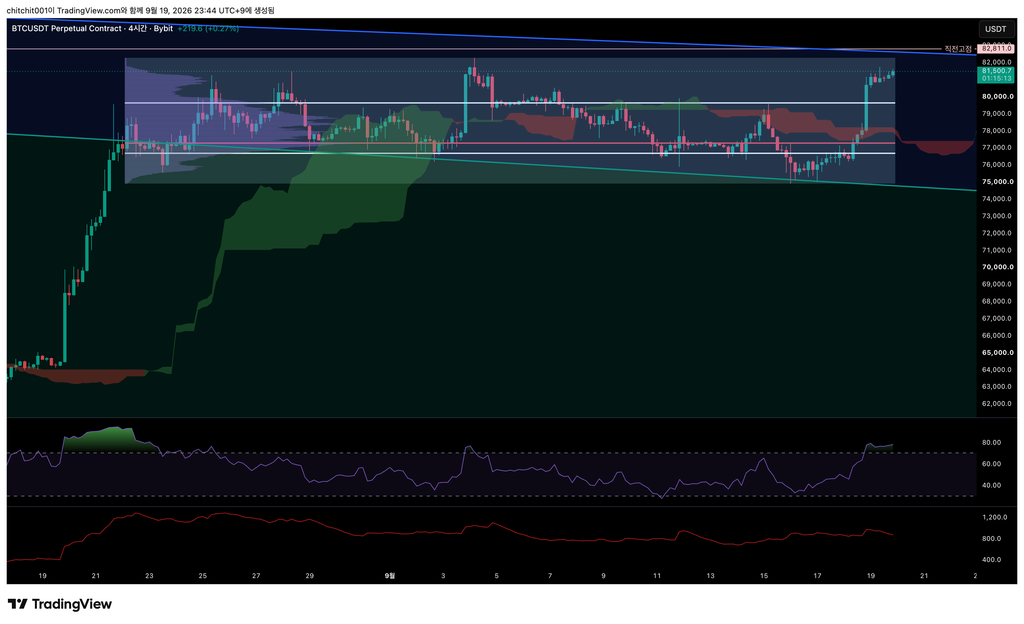
[4-Hour Chart]
- Price has moved above the VAH of the consolidation range and is now heading toward the next volume zone.
- The pace of the rally is slowing, and price is gradually beginning to move sideways. For now, I will wait and watch the VAH. If price fails to move any higher and then breaks below that level, I intend to close the rest of my position without hesitation.
[Ethereum, ETHUSDT.P]
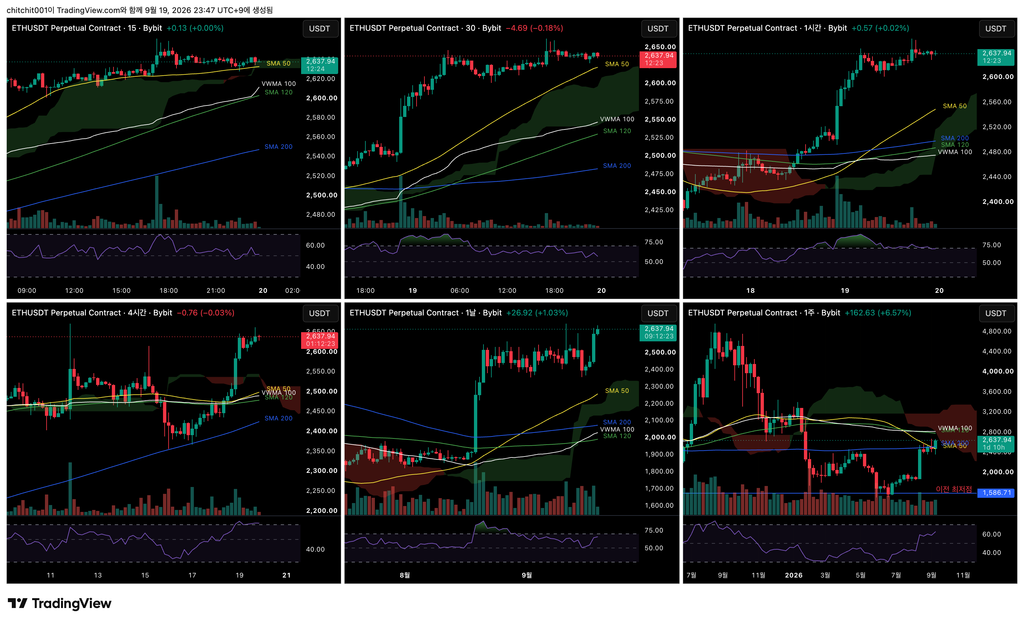
This is a multi-timeframe overview of Ethereum.
- Ethereum’s move looks even more dramatic than Bitcoin’s. Just look at the size of the weekly gain. It is making up for the sluggish price action of the past month in a single move.
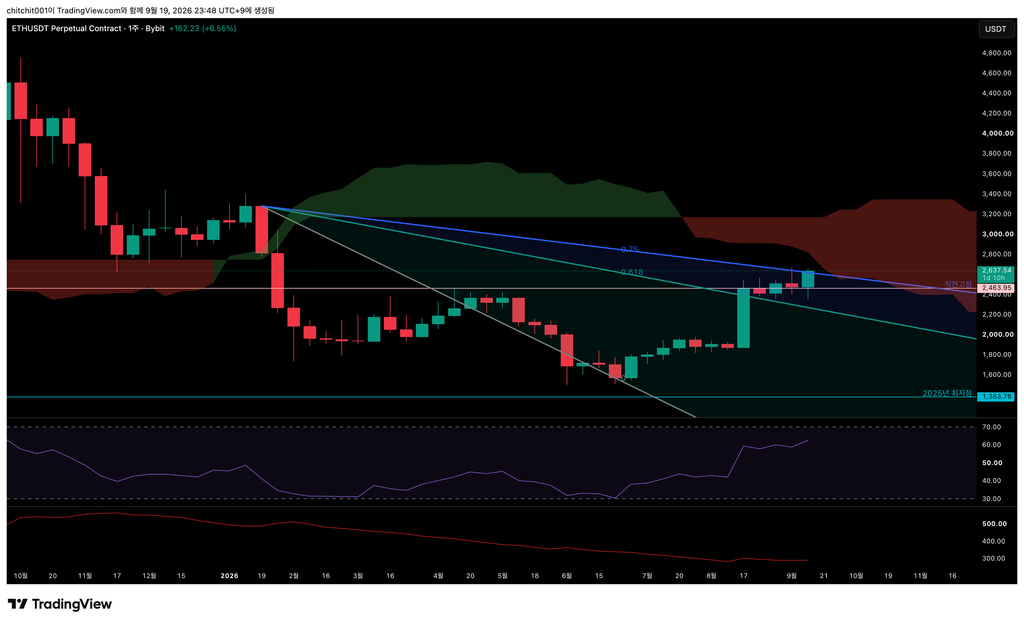
[Weekly Chart]
- Ethereum has reached an important level: the 0.75 level of the Speed Fan. A breakout above this level would suggest a greater likelihood of price reaching the high where the Speed Fan begins.
- For that same reason, however, this level could also act as resistance as traders take profit or sell for other reasons.
- Anyone already holding a position may want to monitor it through the weekly close, provided there is no major volatility.
- I entered my position relatively late, so I have decided to wait and watch. You can refer to my previous post to see where I entered.
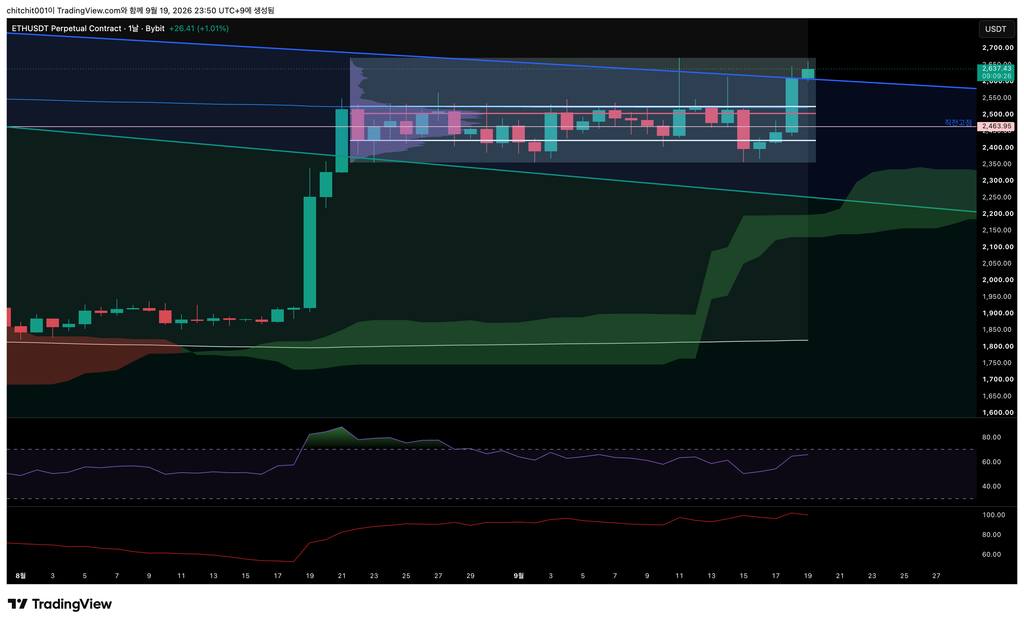
[Daily Chart]
- On the shorter timeframe, you can see that price has already moved above the 0.75 level of the Speed Fan. For now, this level appears more likely to act as support.
- I am currently holding a position with the intention of cutting my loss if price breaks back below this level.
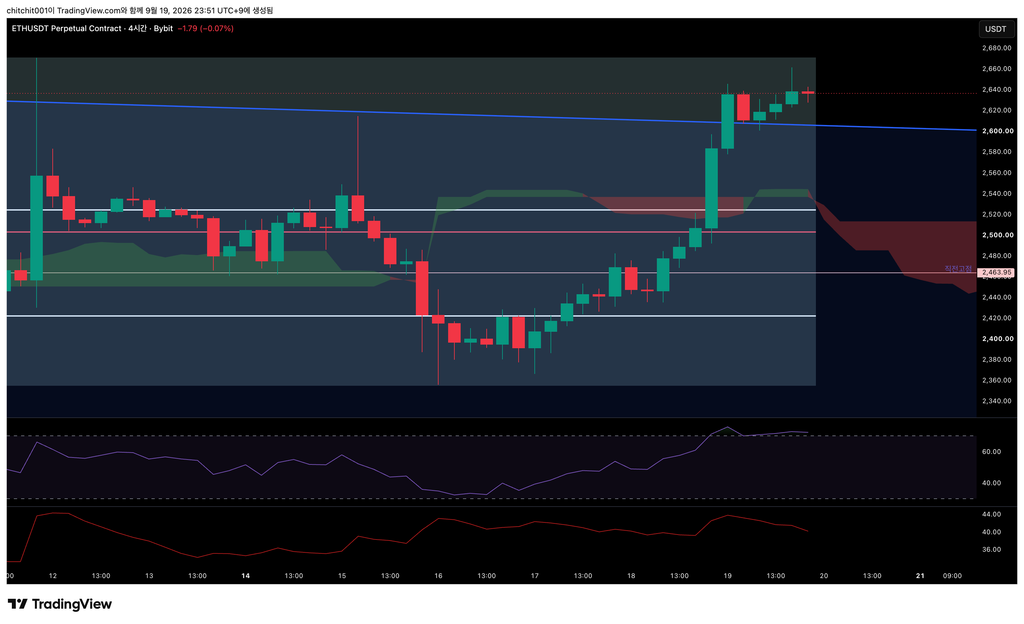
[4-Hour Chart]
- Price broke above the Speed Fan, pulled back, found support precisely at the Speed Fan, and has been rising since then.
- This confirms that the 0.75 level of the Speed Fan is a key battleground. A break below this level would indicate that bullish momentum has weakened and that buyers have lost the battle. In that case, I believe closing the position would be the appropriate response.