This post is a personal investment journal based on my own market study and observations. It is not financial advice or a recommendation to buy or sell any asset. Each investor is responsible for their own investment decisions, so please make careful decisions based on your own judgment and risk tolerance.
[Bitcoin, BTCUSDT.P]
This is a multi-timeframe overview of Bitcoin. Starting from the upper left and following a Z-shaped order, the charts show the 15-minute, 30-minute, 1-hour, 4-hour, daily, and weekly timeframes.
- At a glance, price is above the bullish Ichimoku cloud on the 15-minute, 30-minute, 1-hour, and daily charts. This makes me wonder whether the market is gradually turning upward. Let’s take a closer look at each timeframe.

[Weekly Chart]
- Price has not broken below the 0.618 level of the descending Speed Fan. If this week’s candle closes bullish, there may be some reason for optimism.
- The area highlighted in orange also looks like it may be forming a cup-and-handle pattern. This pattern consists of a rounded cup followed by a smaller pullback forming the handle, potentially leading to a strong upward breakout.
- However, a thick bearish Ichimoku cloud lies ahead, and the previous high was around $82,800. Since this is the weekly chart, we could see roughly two to three weeks of upward movement, but I also need to consider the possibility of resistance and a pullback after that.
[Daily Chart]
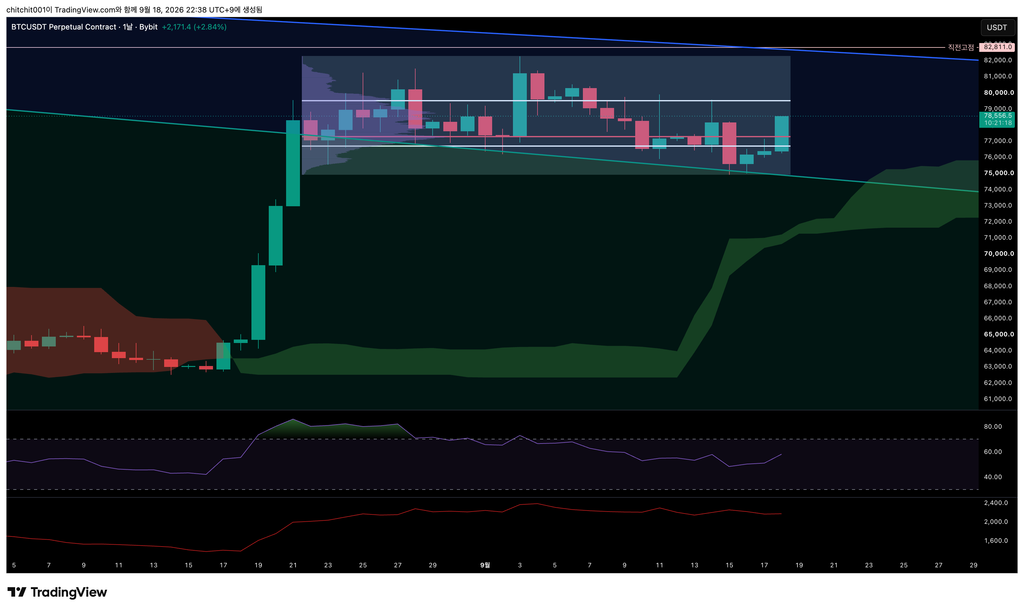
- Bitcoin has been moving sideways for the past month. Looking at the volume profile for this consolidation period, the POC and VAL are close together. My interpretation is that the prolonged sideways movement has concentrated activity from both long and short traders within a similar price range.
- Today’s strong rally pushed price decisively above the POC, and it is now approaching the VAH. We saw something similar during the previous rally: after breaking above the VAH, price continued higher toward the next volume zone. If I were not already in a position, one possible entry would be to wait for a breakout above the VAH at $79,515, followed by a pullback to retest that level.
- I see a higher probability of support at the VAL, which would give me a clearer basis for a trade than entering at the current, less decisive level.
[Ethereum, ETHUSDT.P]
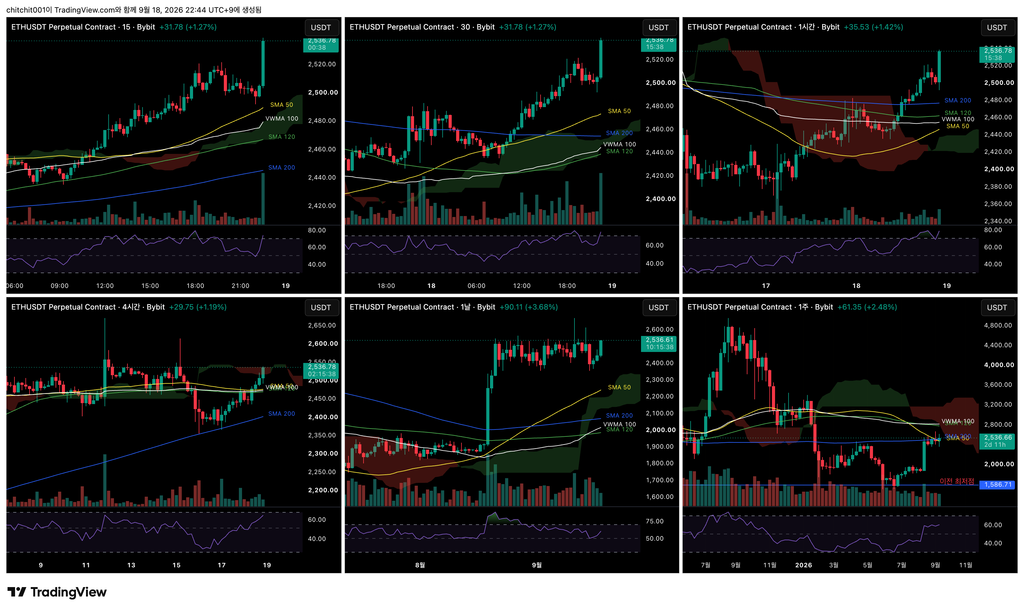
This is a multi-timeframe overview of Ethereum.
- Ethereum is making a strong move higher as I write this. Let’s take a closer look at each timeframe.
[Weekly Chart]
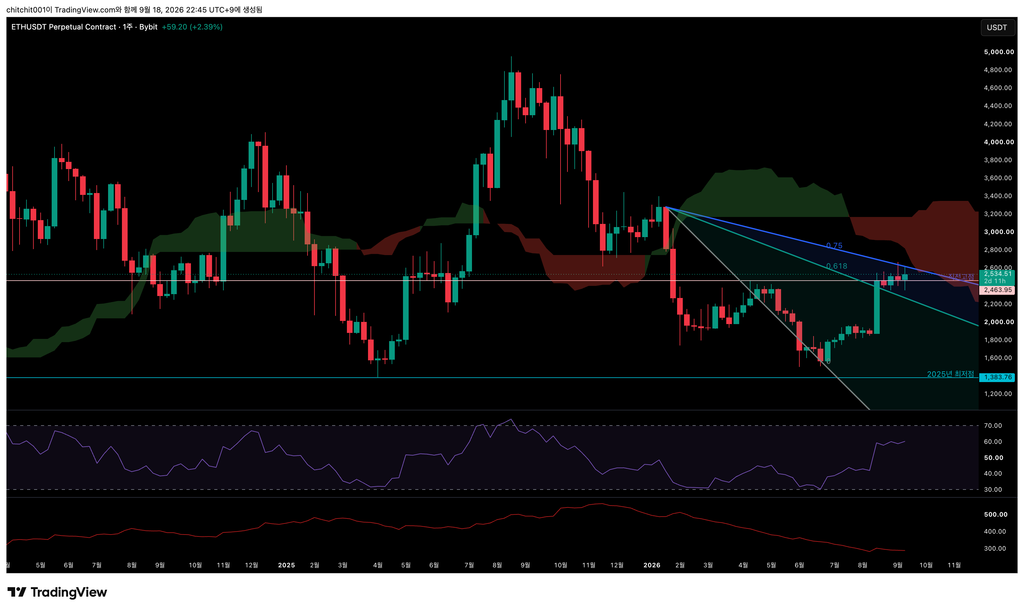
- Price continues to hold above the 0.618 level of the descending Speed Fan. Bitcoin has repeatedly tested this level, while Ethereum has not even touched it.
- Ethereum has also been consolidating near its previous high for about a month. Its lows are gradually rising, so if the weekly candle closes with this structure intact, I would cautiously expect the longer-term direction to turn upward.
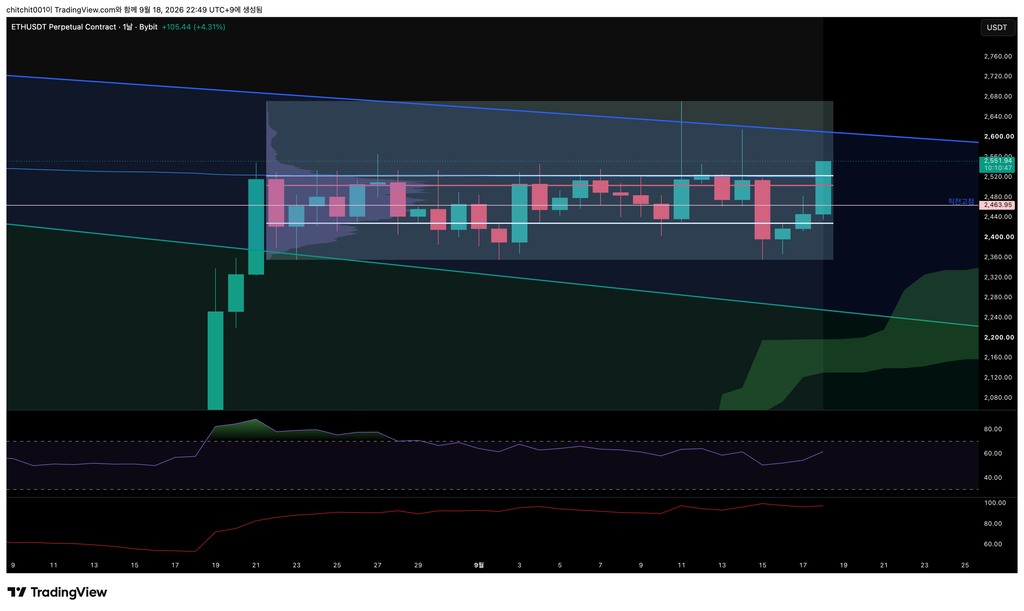
[Daily Chart]
- Looking at the volume profile for the past month, price has broken above the VAH. If the daily candle closes above it, I would expect price to move toward a new volume zone higher up.
- If I were looking to buy Ethereum, one possible approach would be to wait for a pullback to the VAH at $2,524 tonight.