This post is a personal investment journal based on my own market study and observations. It is not financial advice or a recommendation to buy or sell any asset. All investment decisions and responsibilities belong to each individual investor, so please make careful decisions based on your own judgment and risk tolerance.
[Bitcoin, BTCUSDT.P]
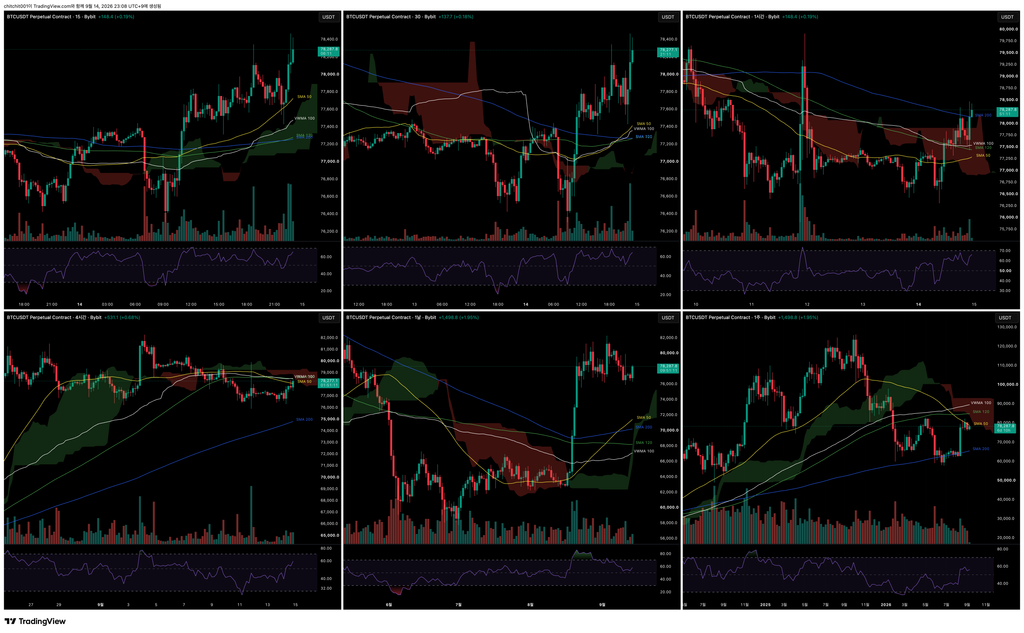
This is the comprehensive Bitcoin chart. From the upper left in a Z-shaped order, the timeframes are the 15-minute, 30-minute, 1-hour, 4-hour, daily, and weekly charts.
- The weekly candle closed bearish, and Bitcoin continues to make lower lows. Today started with a bullish candle, but if this week also closes while making another lower low, the situation could become worse. Since Bitcoin is up more than 2% today, it may raise the question of whether it is finally moving upward. However, I think it is important to keep in mind that the broader direction is still pointing downward.
- On the daily chart, bearish divergence is in place. The candles are moving sideways while the RSI is falling. Unless I become confident that the direction has clearly turned upward, I think it is better to watch for now.
- On the shorter timeframes, the market is moving strongly sideways both up and down, so it is difficult to find much using moving averages alone. If I had to point out one thing, it would be that the candles are moving above the VWMA 100. The short-term timeframes are continuing to try to move upward, while the longer-term timeframes still show relatively weak strength.

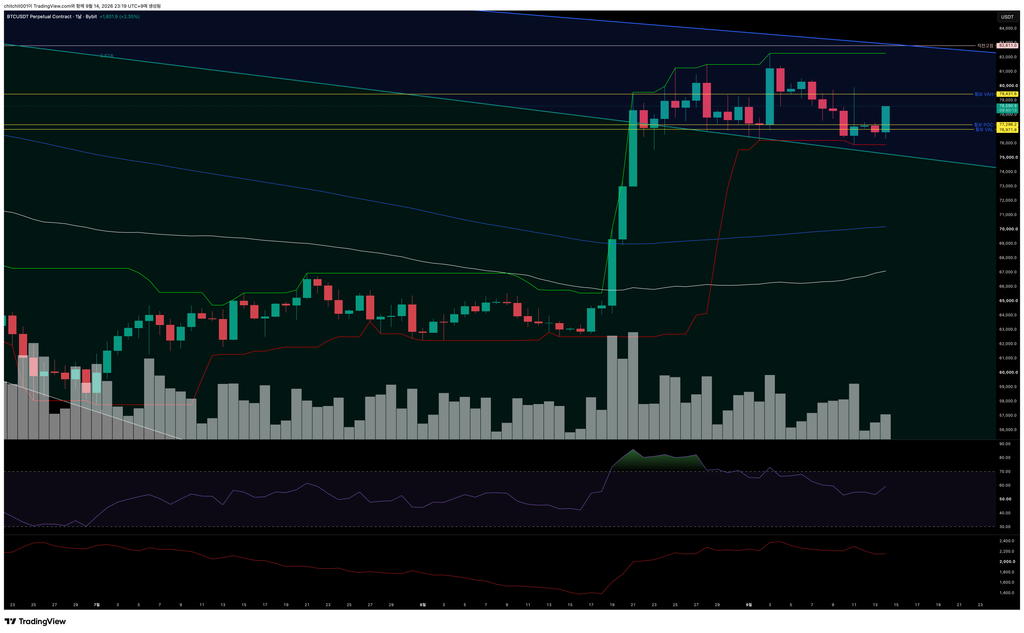
[Daily Chart]
- I drew the volume zone for the sideways range. The POC was formed quite low, and Bitcoin moved sideways around that area last week before breaking above it today.
- If price maintains this flow and breaks above the VAH, I will consider betting on the upside. If it breaks below the VAL, I will consider betting on the downside.

[1-Hour Chart]
- There is an orange downward parallel channel. Bitcoin had been declining within this channel, but it has now broken above it.
- Although it is forming a long upper wick, the fact that it broke out of the downward pattern means I need to consider the possibility of upside. At the same time, I also need to remember that the previous time it broke above this area, it dropped sharply soon after. If betting on the upside, a tight stop-loss is necessary.
[Ethereum, ETHUSDT.P]

This is the comprehensive Ethereum chart. I do not have a major view here. It is similar to Bitcoin.

[Daily Chart]
- Ethereum continues to move sideways around the previous high. Since the direction is difficult to read, I think it is better to wait.

[4-Hour Chart]
- Ethereum is moving sideways between the VAH, POC, and the previous high. Unless it breaks above the VAH, I do not plan to consider upside for now.