This post is a personal investment journal based on my own market study and observations. It is not financial advice or a recommendation to buy or sell any asset. Each investor is responsible for their own investment decisions, so please make careful decisions based on your own judgment and risk tolerance.
[Bitcoin, BTCUSDT.P]
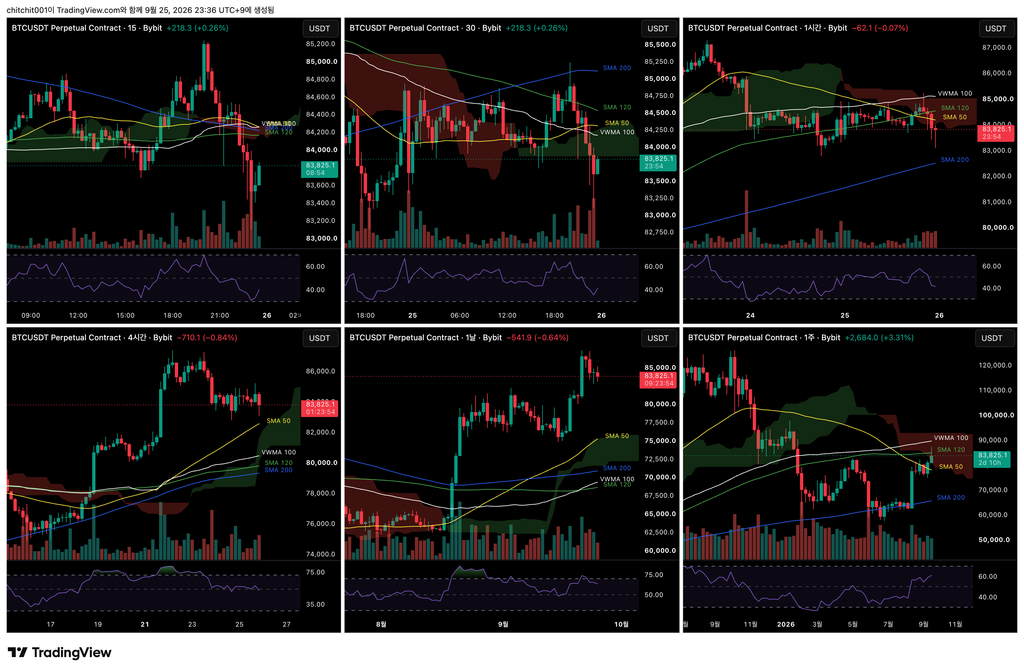
This is a multi-timeframe overview of Bitcoin. Starting from the upper left and following a Z-shaped order, the charts show the 15-minute, 30-minute, 1-hour, 4-hour, daily, and weekly timeframes.
- Another bearish candle has formed today, causing the weekly candle to give back a significant portion of its gains. The weekend is now beginning, and buying pressure often weakens during the weekend, leaving the market vulnerable to further declines. I will be watching to see how well the price holds up.
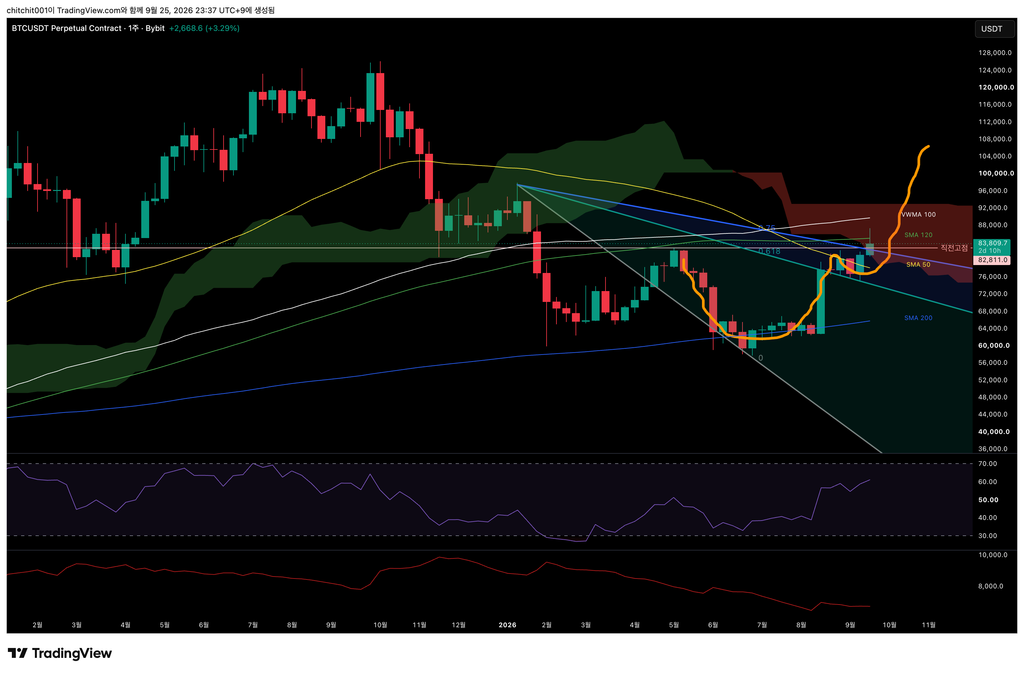
[Weekly Chart]
- Price is still holding above the 0.75 level of the Speed Fan. Let’s see where the weekly candle closes after the weekend.
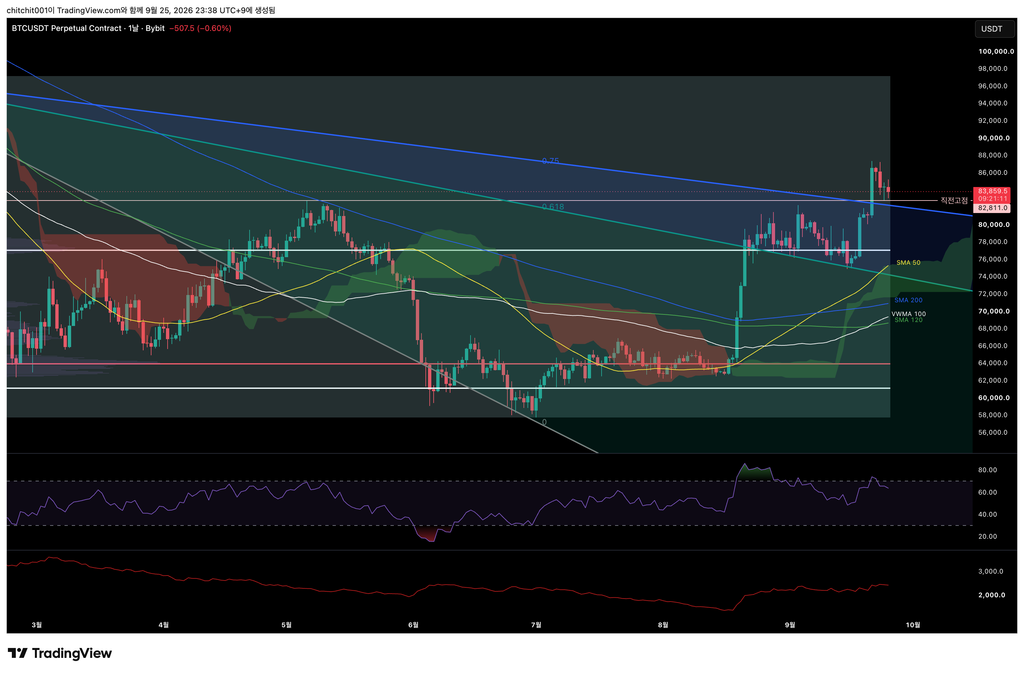
[Daily Chart]
- Price has fallen close to the previous high. I think we need to watch a little longer to see whether it finds support here and rebounds.
- Because the recent rally carried price above the volume profile’s VAH, there is still room for it to move higher. However, if price continues to slide and returns to the VAH, I will consider selling my position. For now, I plan to wait and observe.
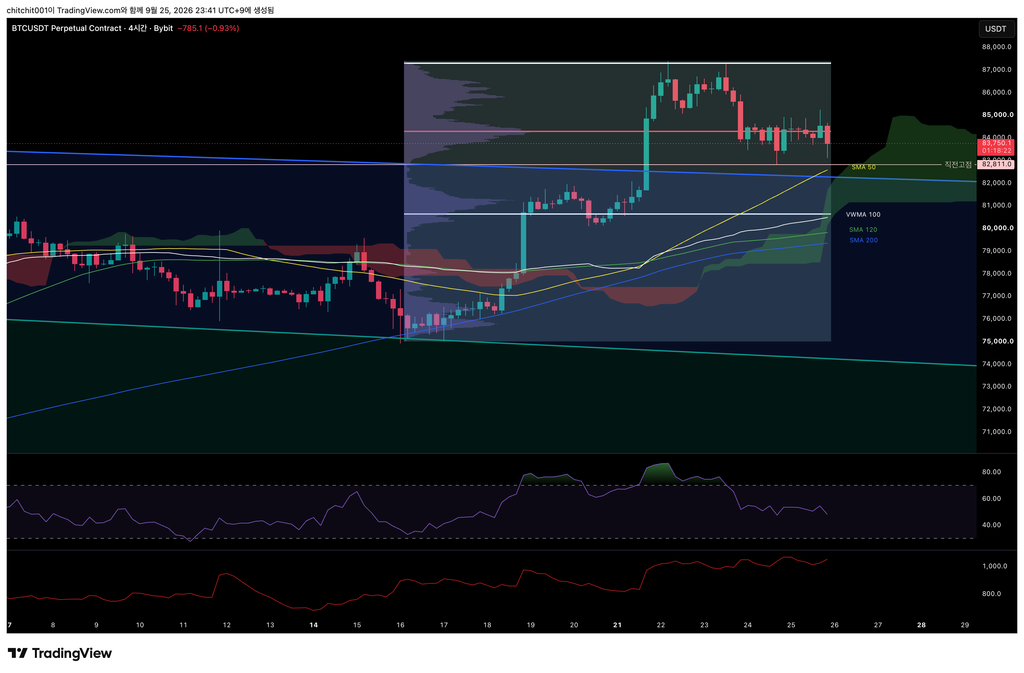
[4-Hour Chart]
- On the 4-hour volume profile, price is currently around the POC. It has been consolidating here for the past two days and four hours.
- This is a level from which price could either rise sharply or break down significantly. A thick bullish Ichimoku cloud lies ahead, so if price can simply consolidate throughout the weekend, I may have some reason to expect another move higher.
[Ethereum, ETHUSDT.P]
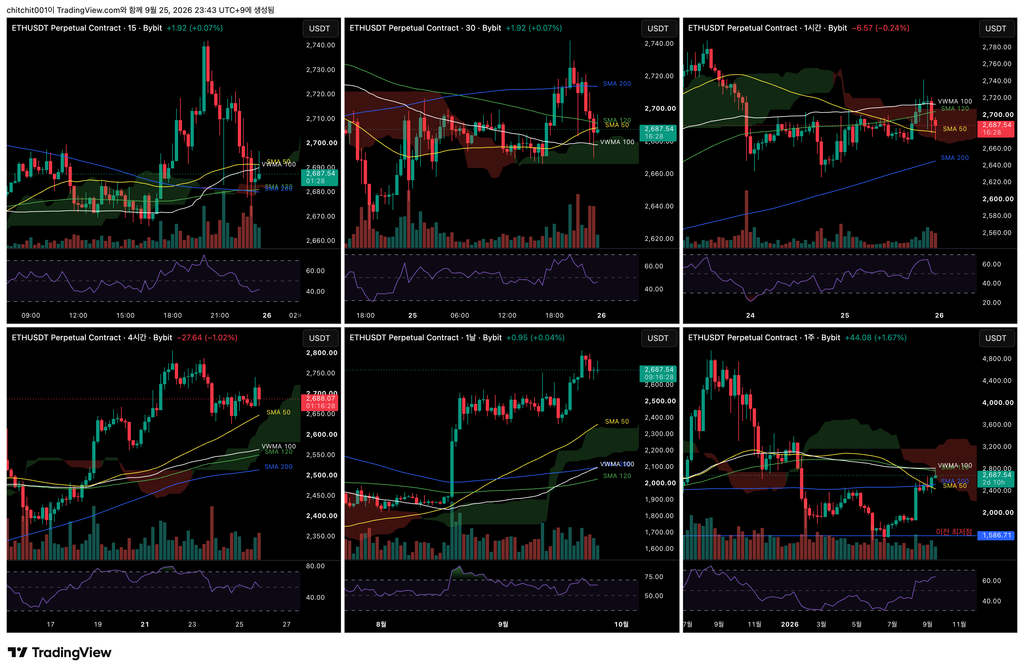
This is a multi-timeframe overview of Ethereum.
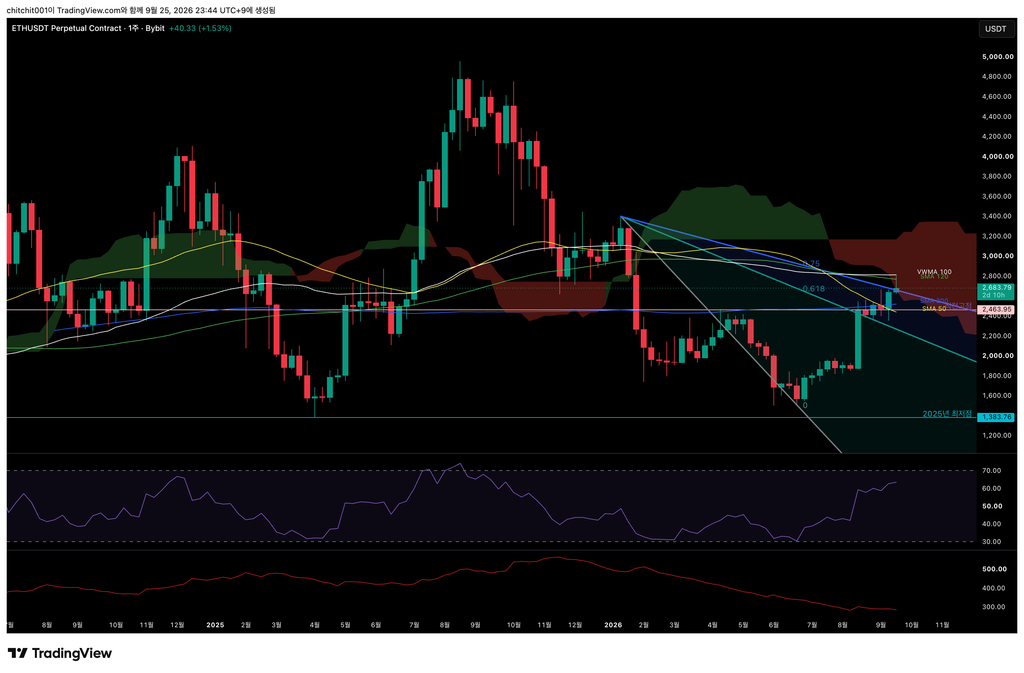
[Weekly Chart]
- There is nothing particularly unusual here. Ethereum is following a similar pattern to Bitcoin. The key question is whether price breaks below the Speed Fan over the weekend.
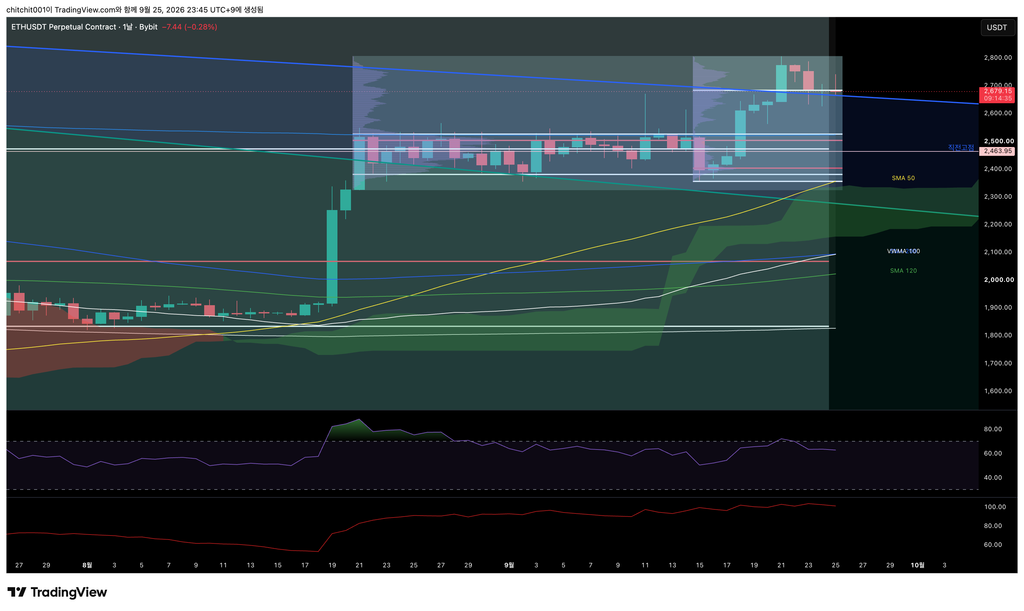
[Daily Chart]
- Of the two volume profiles shown, the one on the right represents the most recent trading range. Price is currently consolidating around its VAH.
- As with Bitcoin, this appears to be a period of consolidation after the recent sharp rally.