This post is a personal investment journal based on my own market study and observations. It is not financial advice or a recommendation to buy or sell any asset. Each investor is responsible for their own investment decisions, so please make careful decisions based on your own judgment and risk tolerance.
[Bitcoin, BTCUSDT.P]
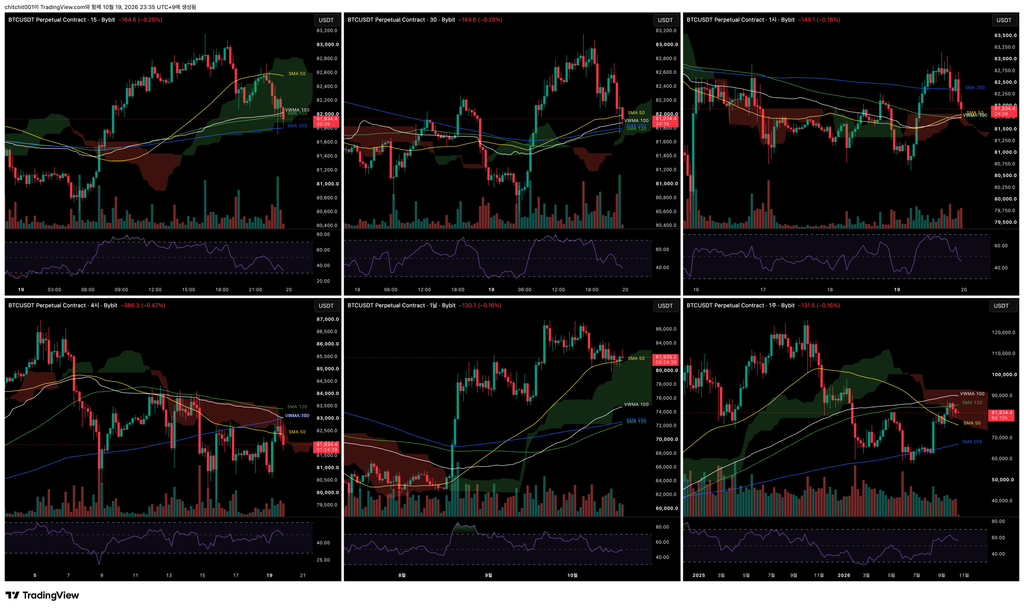
This is a multi-timeframe overview of Bitcoin. Starting from the upper left and following a Z-shaped order, the charts show the 15-minute, 30-minute, 1-hour, 4-hour, daily, and weekly timeframes.
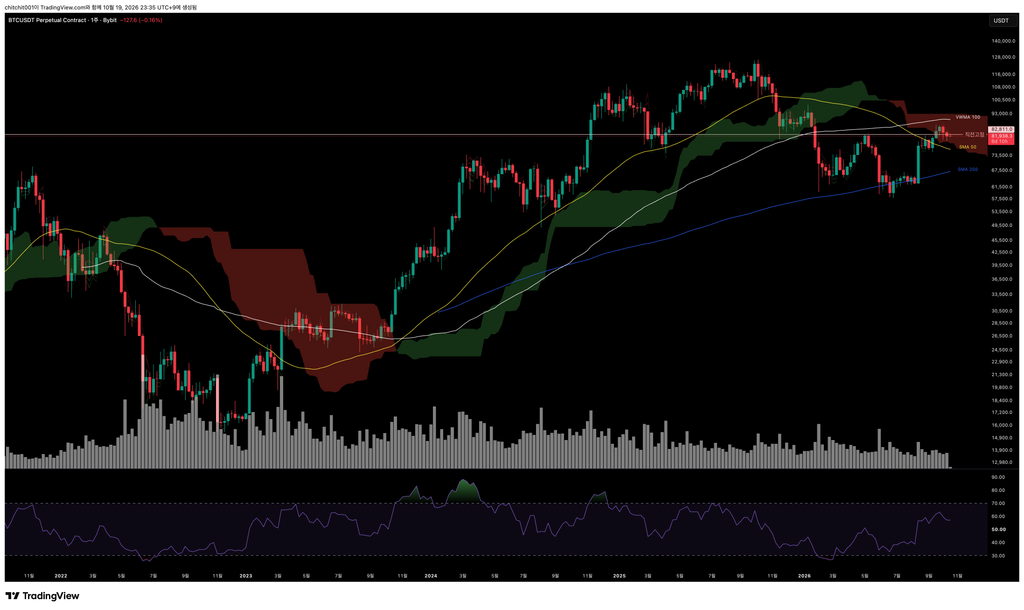
[Weekly Chart]
- The SMA 50 and SMA 200 are approaching a death cross on the weekly chart as well. This suggests that downward pressure is growing stronger.
- Price looked as though it might break above the May 4 high, but it failed and has since fallen back.
- It has also been unable to break through the bearish Ichimoku cloud.
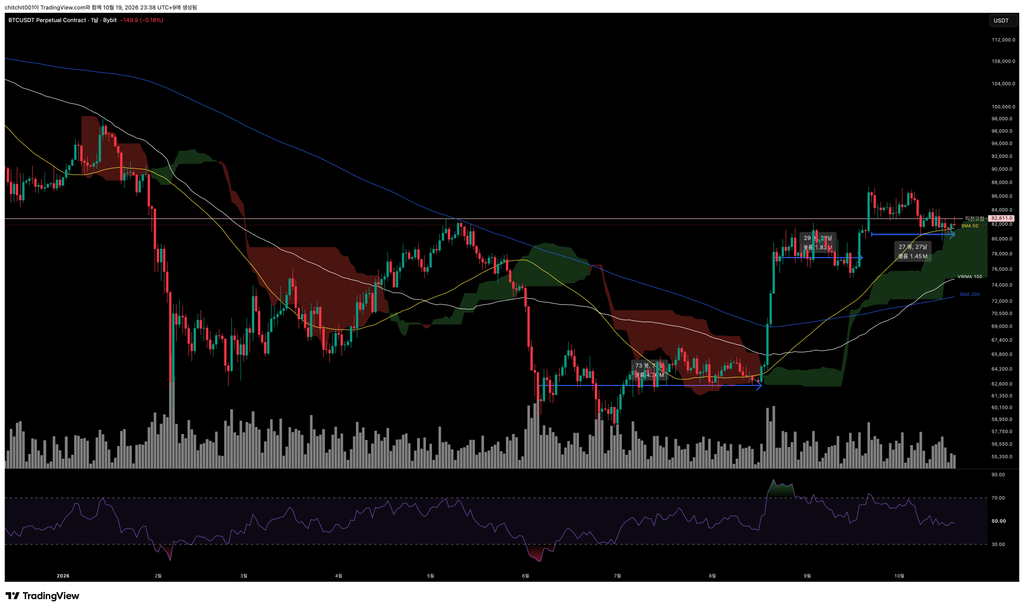
[Daily Chart]
- The current consolidation has lasted 27 days as of today, compared with 29 days for the previous one. The two periods are now similar in length, highlighting the market’s lack of momentum.
- Look at trading volume over that period—it has been gradually declining. The RSI is also trending lower. Overall, I think it makes sense to maintain a bearish outlook.
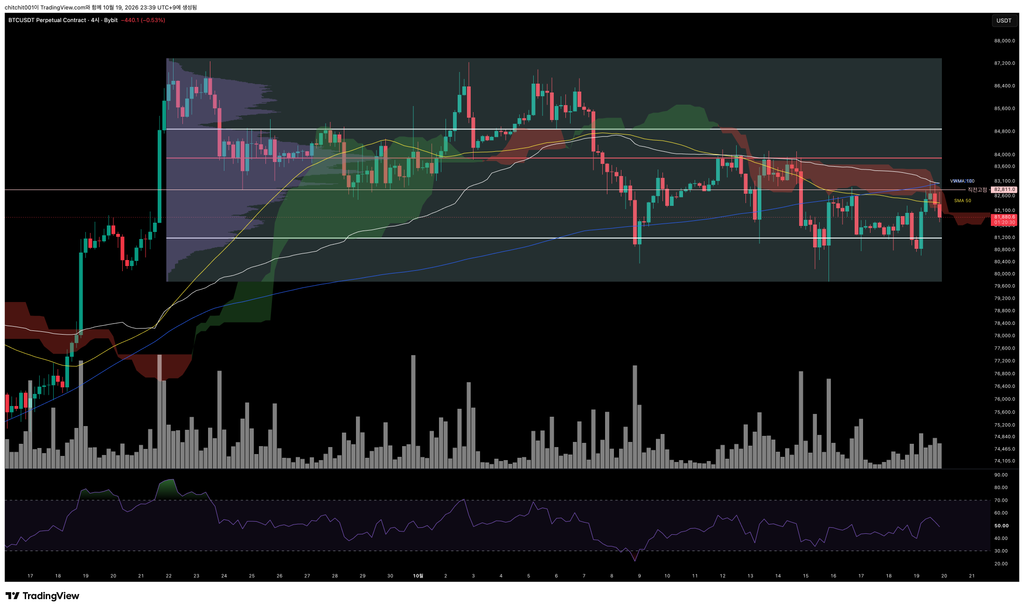
[4-Hour Chart]
- Following the death cross between the SMA 50 and SMA 200, the recent advance has lost momentum, and price is falling again.
- This is consistent with the growing downward pressure I mentioned on the longer-term charts.
- For now, I would give more weight to the downside.
[Ethereum, ETHUSDT.P]
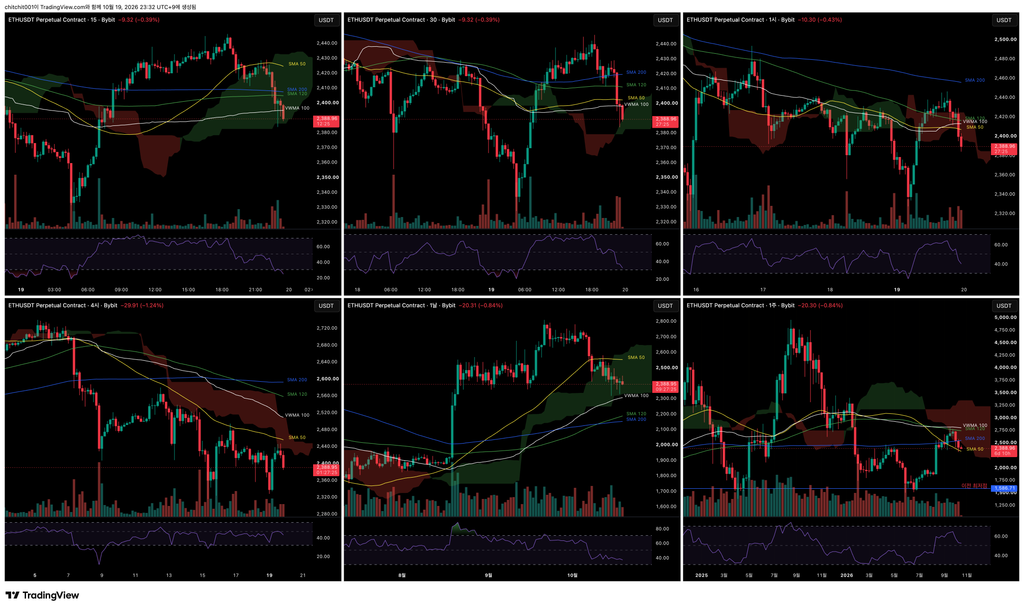
This is a multi-timeframe overview of Ethereum.
- Let’s focus on just one thing: trading volume on the weekly chart has been steadily declining. What does reduced trading activity in Ethereum suggest? An unexpected influx of buying could trigger a sharp rally, but I see continued downward pressure as the more likely outcome.
- There is little need for a lengthy analysis. At the moment, Ethereum’s outlook looks even weaker than Bitcoin’s.