This post is a personal investment journal based on my own market study and observations. It is not financial advice or a recommendation to buy or sell any asset. Each investor is responsible for their own investment decisions, so please make careful decisions based on your own judgment and risk tolerance.
[Bitcoin, BTCUSDT.P]
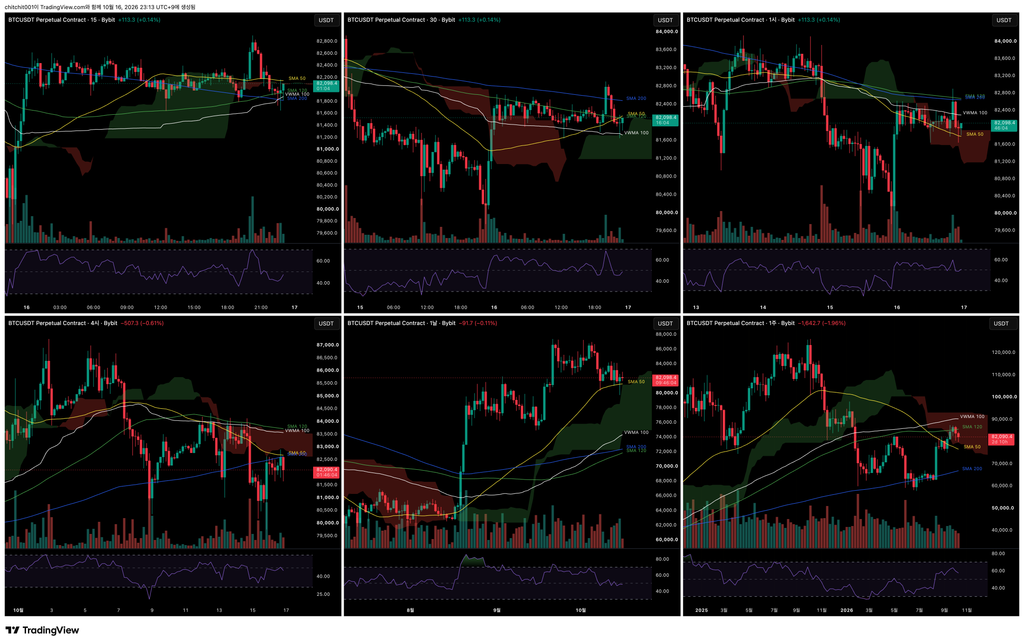
This is a multi-timeframe overview of Bitcoin. Starting from the upper left and following a Z-shaped order, the charts show the 15-minute, 30-minute, 1-hour, 4-hour, daily, and weekly timeframes.
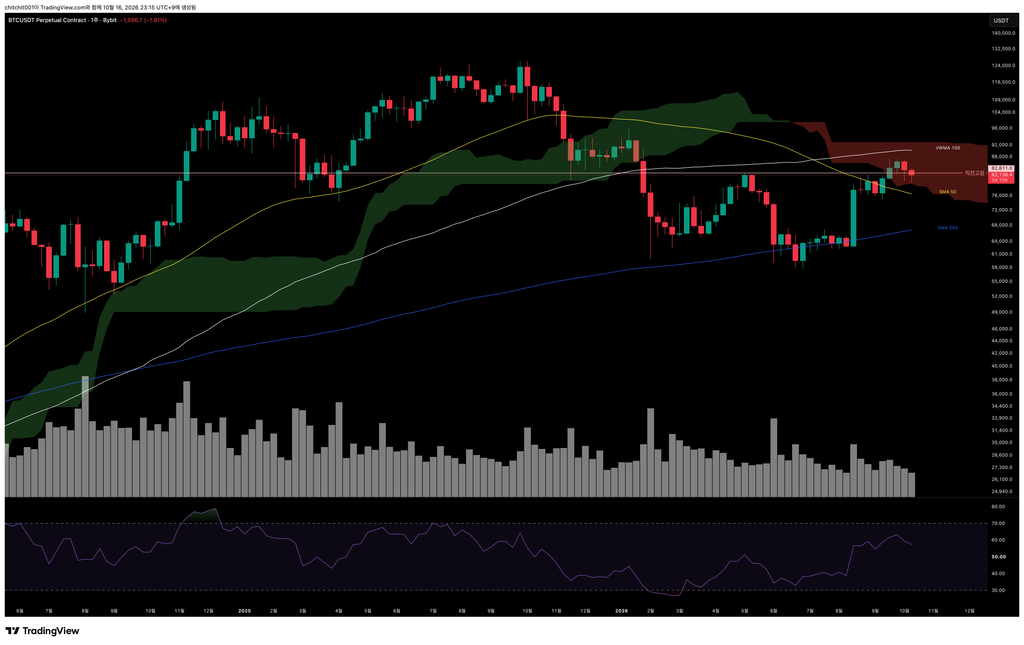
[Weekly Chart]
The uneventful market conditions have continued. I have not posted for a while because there was little to write about, although I have continued watching the charts.
On the weekly chart, price is being pushed lower after failing to break through the bearish Ichimoku cloud. Two consecutive bearish weekly candles do not paint a particularly encouraging picture.
The SMA 50 is also declining and approaching a death cross with the SMA 200. For now, a bearish outlook seems more appropriate to me.
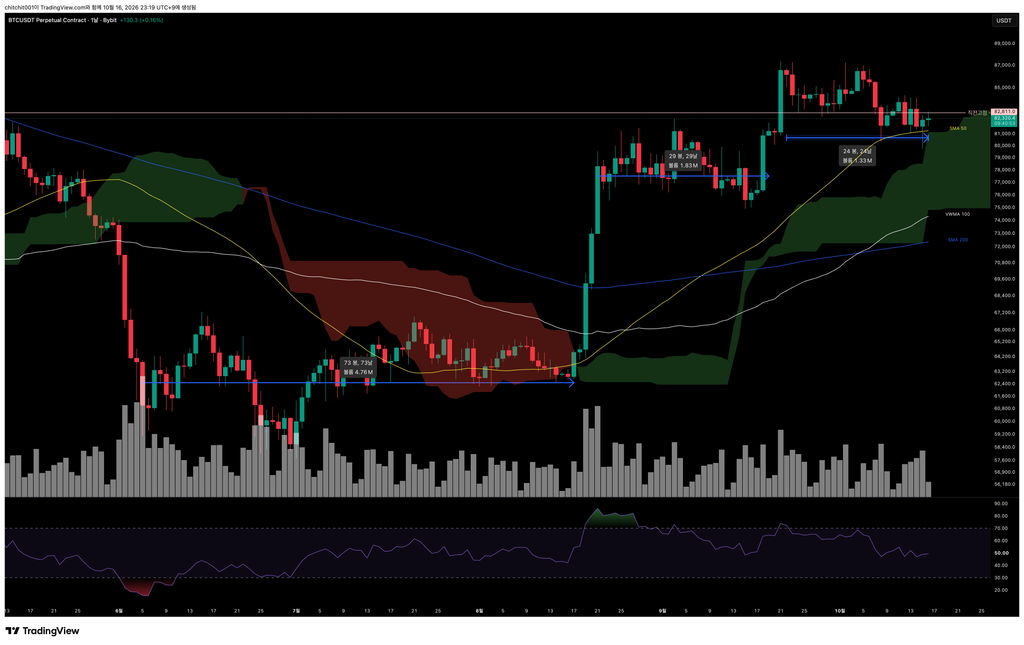
[Daily Chart]
The consolidation is dragging on. Price has been moving sideways for 24 days, largely within the range of the large bullish candle formed on September 21.
The previous two consolidations led to rallies. This time, however, the weekly chart suggests that we need to consider a longer-term decline. I do not think we should treat the current consolidation the same way as the previous two.
The one reassuring sign is that price is still finding support at the SMA 50. If that support breaks as well, I would be almost completely convinced of the bearish case.
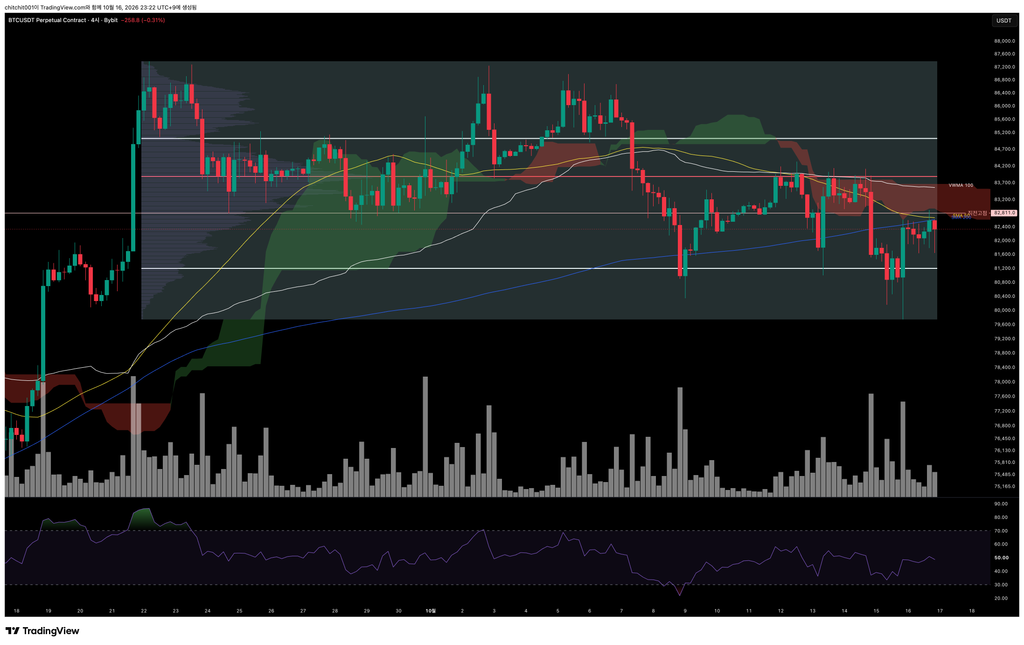
[4-Hour Chart]
Looking at the volume profile, price has remained largely between the VAH and VAL.
There may be opportunities for short-term trades within this range. However, getting the direction wrong could just as easily lead to a painful series of losses.
Overall, I think a bearish bias is more appropriate. At a minimum, I would need to see the moving averages begin turning upward before considering a bullish outlook. If I were trading futures, I would be looking at the chart primarily for potential short setups.
[Ethereum, ETHUSDT.P]
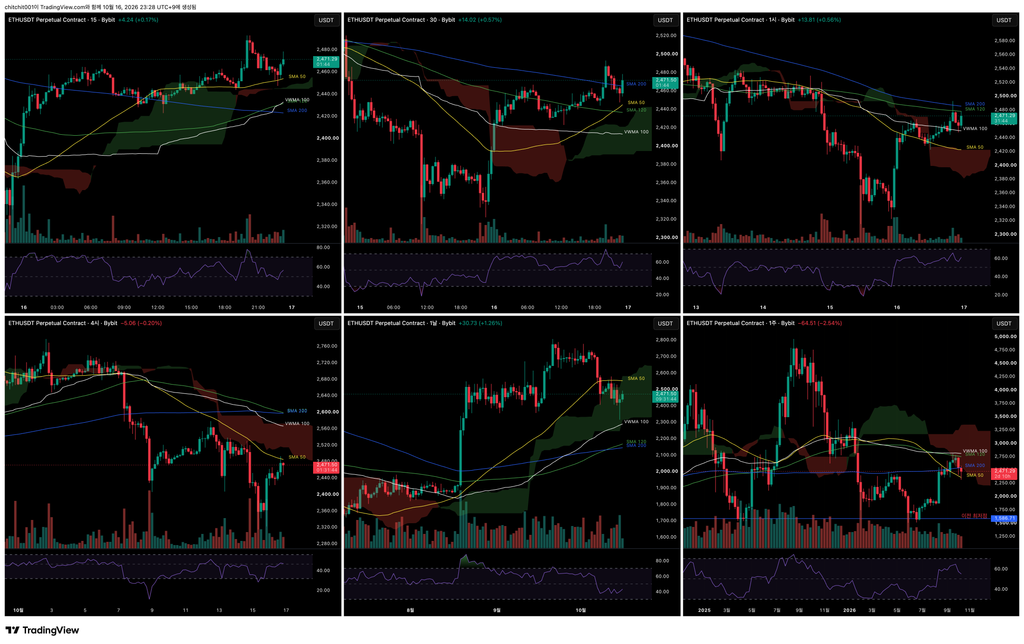
This is a multi-timeframe overview of Ethereum.
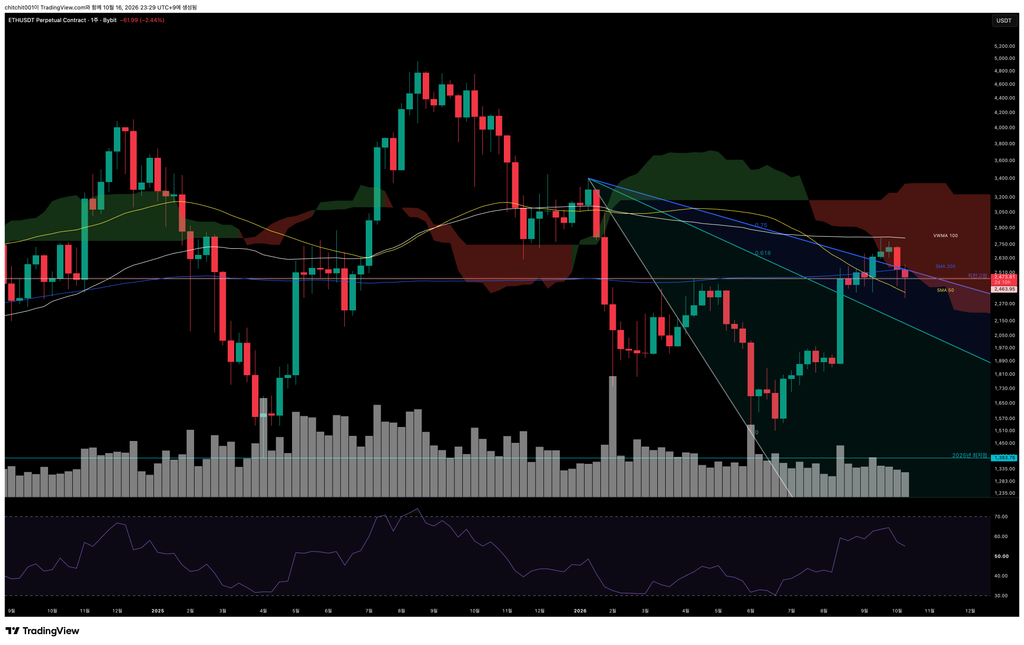
[Weekly Chart]
- Like Bitcoin, Ethereum continues to decline, but its losses are larger. The altcoin market had been heating up, and it now feels as though that enthusiasm is cooling.
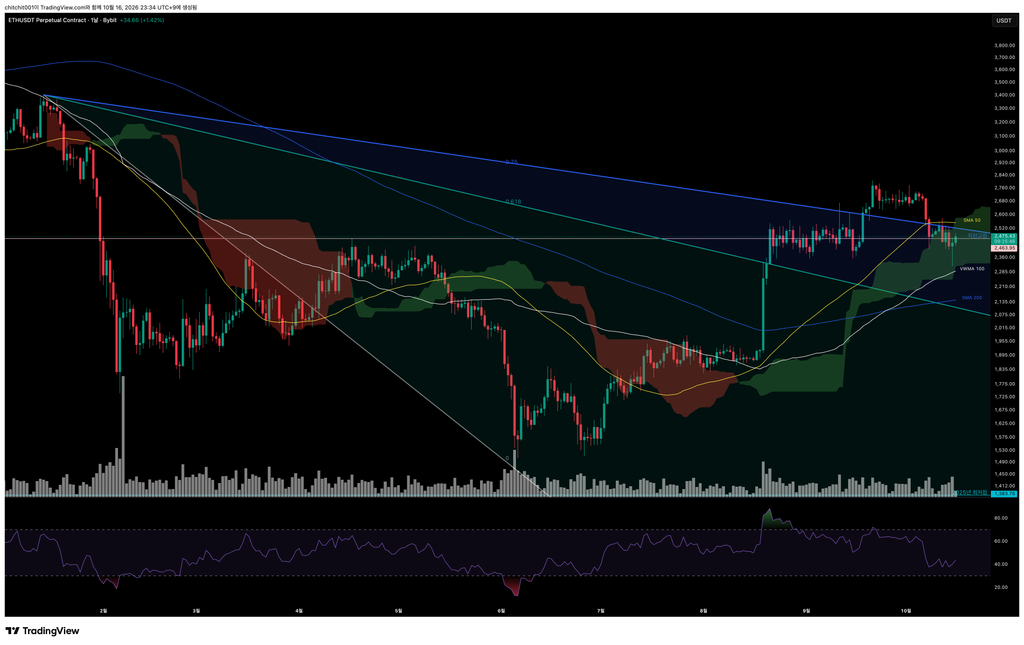
[Daily Chart]
- The moving averages remain in a bullish alignment, but the slope of the SMA 50 has turned negative.
- The bullish Ichimoku cloud ahead offers some hope for a recovery. Still, Bitcoin sets the tone for the broader market, so I would want to see Bitcoin recover first.
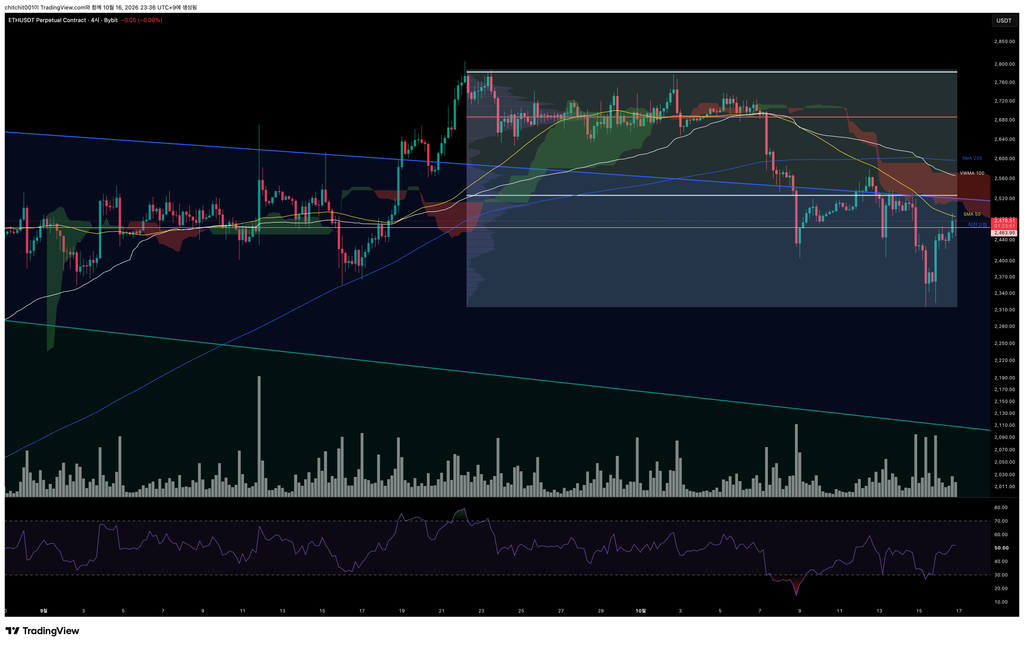
[4-Hour Chart]
- Price has moved well outside the volume profile’s VAH–VAL range.
- With price now so far below that range, I do not find much value in using it to interpret the current price action.
- I plan to revisit this setup once price has at least moved back inside the value area.