This post is a personal investment journal based on my own market study and observations. It is not financial advice or a recommendation to buy or sell any asset. Each investor is responsible for their own investment decisions, so please make careful decisions based on your own judgment and risk tolerance.
[Bitcoin, BTCUSDT.P]
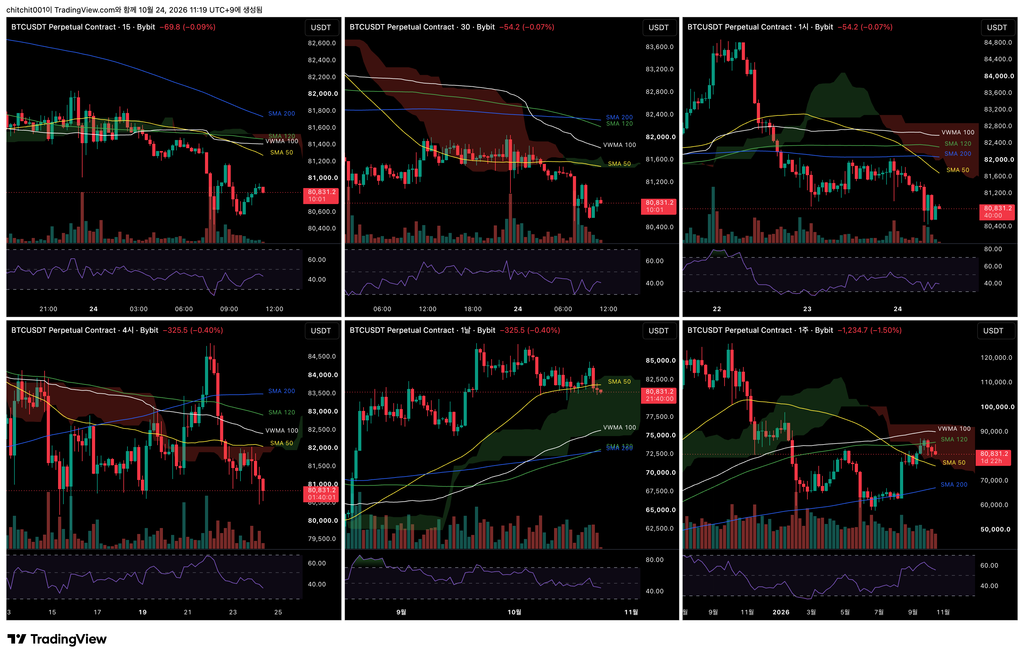
This is a multi-timeframe overview of Bitcoin. Starting from the upper left and following a Z-shaped order, the charts show the 15-minute, 30-minute, 1-hour, 4-hour, daily, and weekly timeframes.
- One thing stands out here: price is inside the bearish Ichimoku cloud on the weekly chart and inside the bullish cloud on the daily chart. The two timeframes are sending conflicting signals. If price breaks above the weekly bearish cloud, bullish momentum on the daily chart could support further gains. Conversely, if price falls below the daily bullish cloud, downward pressure on the weekly chart could reinforce the decline.
- In other words, the market’s direction is difficult to predict right now.
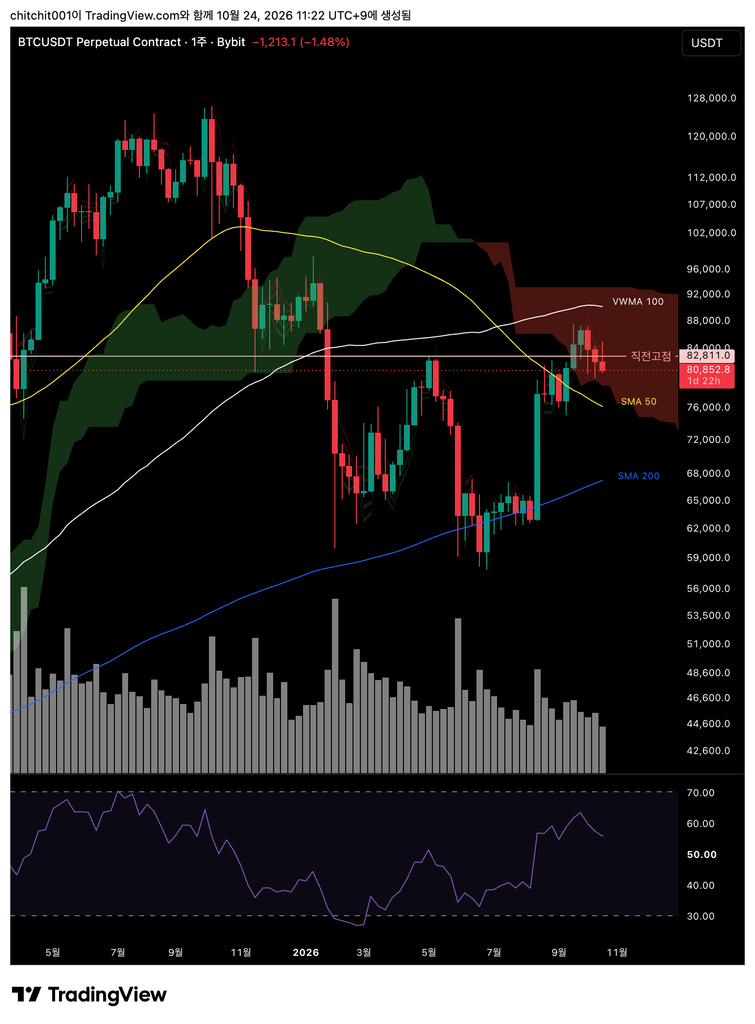
[Weekly Chart]
- The SMA 50 and SMA 200 are gradually approaching a death cross on the weekly chart as well.
- If I had to choose a longer-term direction, it would be down. That is something I need to keep in mind when making trading decisions.
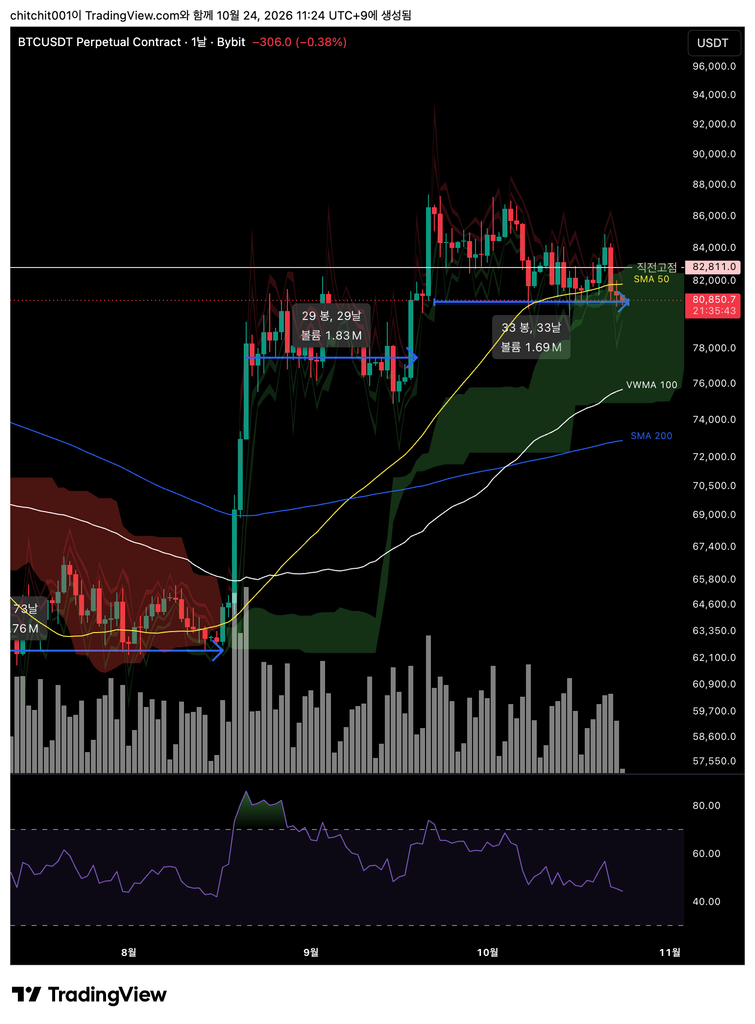
[Daily Chart]
- The SMA 50 is turning sharply downward. Although it remains above the SMA 200, its declining slope could eventually lead to a death cross.
- A series of events with geopolitical implications, including elections in Israel and the United States, could cause substantial market volatility depending on their outcomes. For now, I think holding cash is the better approach.
- Also, look at the peaks in trading volume and the RSI on the chart above. They are getting progressively lower. Volume is declining, and the RSI is moving toward oversold territory. This calls for caution.
[Ethereum, ETHUSDT.P]
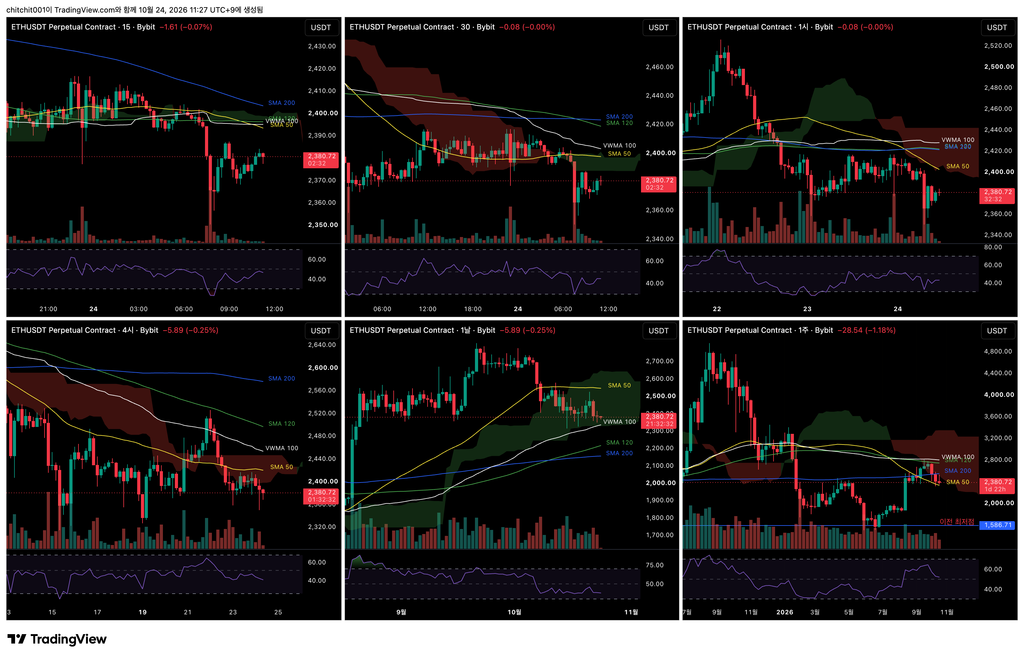
This is a multi-timeframe overview of Ethereum.
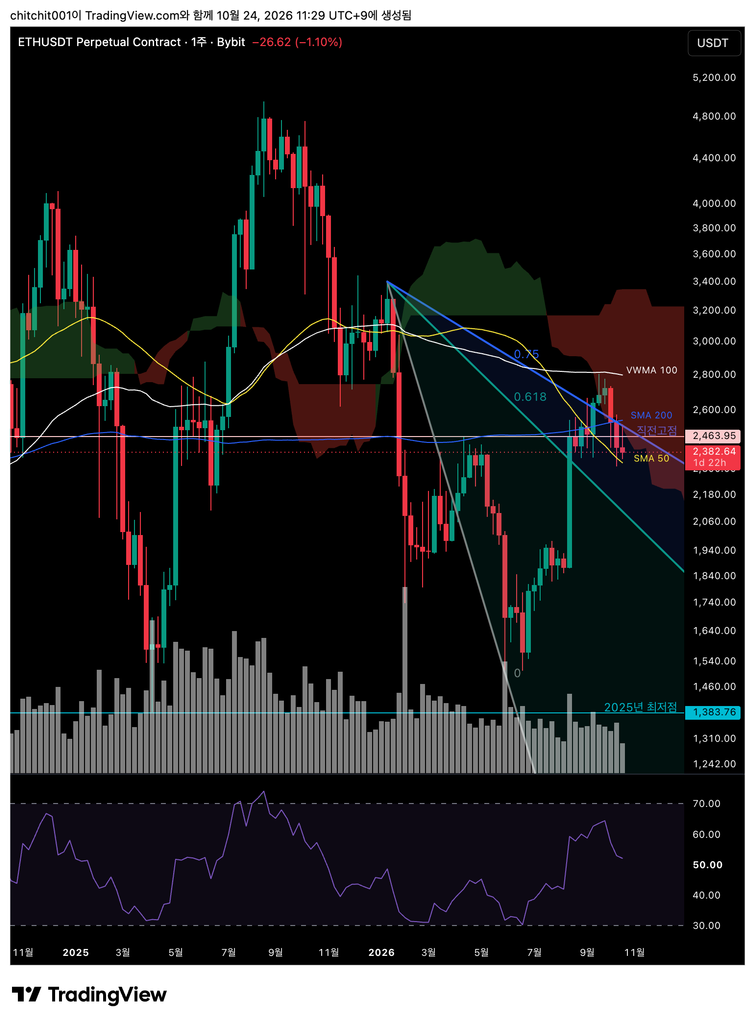
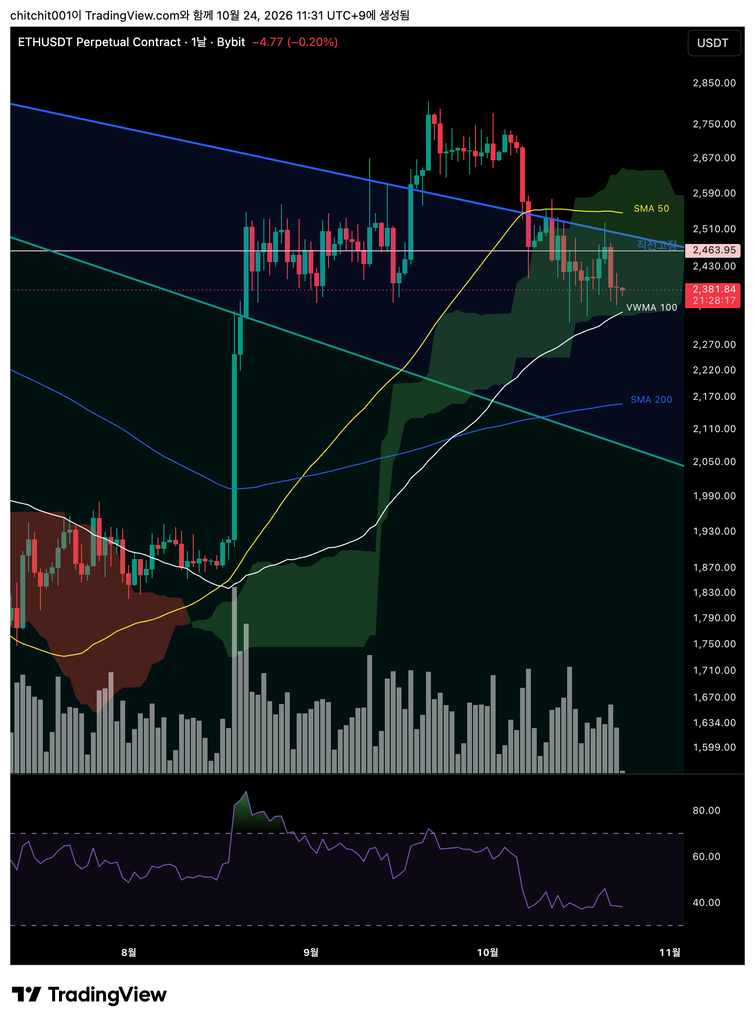
- Can you spot one major difference from Bitcoin? Ethereum is below the bearish cloud on the weekly chart and below the bullish cloud on the daily chart. Bitcoin’s weekly and daily charts are sending conflicting signals, making the outlook less clear. Ethereum’s charts, however, both suggest a bearish bias.
[Weekly Chart]
- Price is falling after failing to break through the bearish cloud. It is also encountering resistance at the descending Speed Fan.
- The moving averages are showing a death cross as well. A bearish outlook seems appropriate to me.
[Daily Chart]
- The SMA 50 has turned sharply downward. The VWMA 100 lies below, but I am skeptical about whether it will hold as support.
- For now, I see this as a time to hold cash and keep greed in check.