This post is simply a personal investment journal based on my own market observations. Please do not take it as investment advice or follow it blindly. Every investment decision is your own responsibility, so please invest carefully and I sincerely hope your decisions lead to successful outcomes.
[Bitcoin, BTCUSDT.P]

This is the comprehensive Bitcoin chart. From the upper left in a Z-shaped order, the timeframes are the 15-minute, 30-minute, 1-hour, 4-hour, daily, and weekly charts.
At the moment, except for the daily chart, every timeframe is interacting with moving-average support or resistance.
As I mentioned yesterday, the market is currently at a point where buyers and sellers are fighting intensely.
This is a period that needs close attention.
[Weekly Chart]
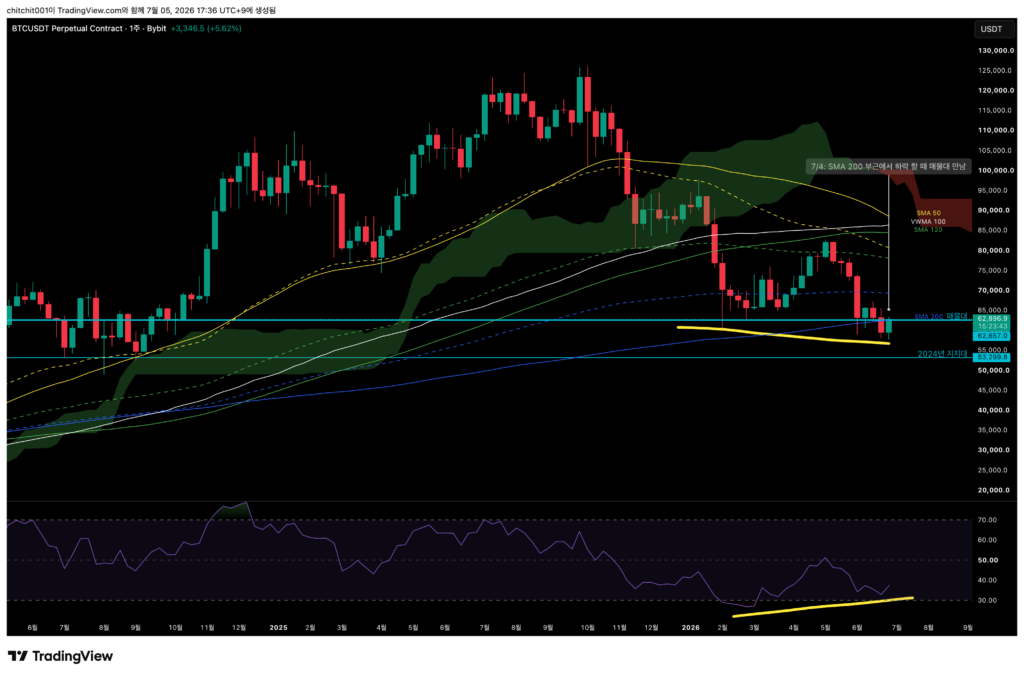
Bitcoin is facing resistance after reaching a major volume zone. We need to see whether it can break through this area overnight and close the weekly candle above it.
Right now, the candle is sitting exactly on that volume zone.
[Daily Chart]
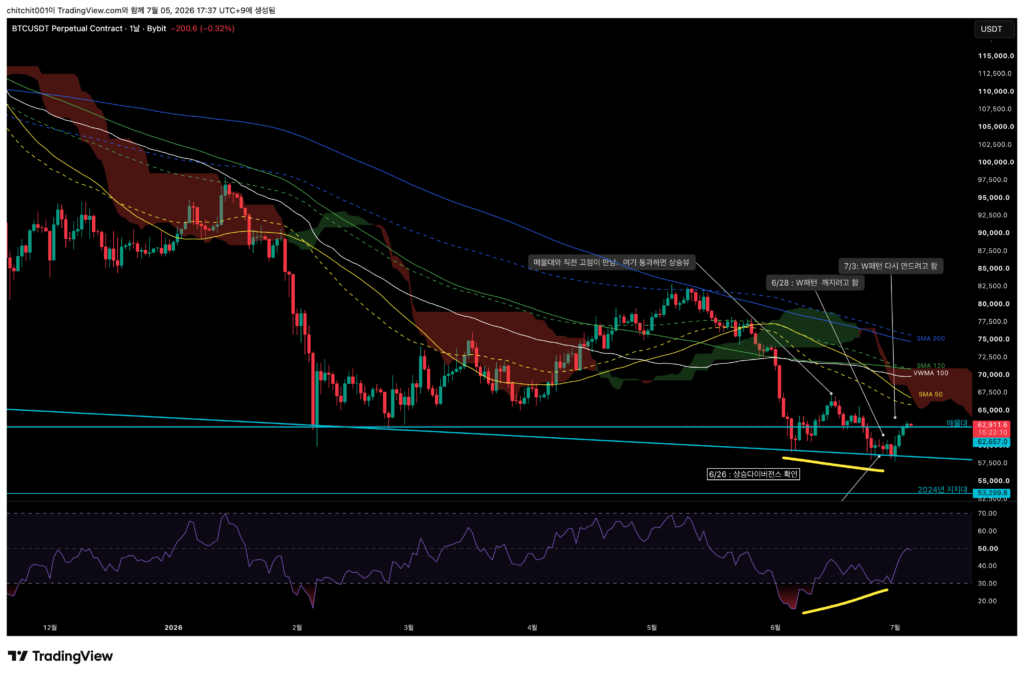
Earlier, I said the daily chart was the only timeframe without moving-average support or resistance.
But in another sense, the daily chart is still meaningful because price has been repeatedly finding support and resistance around the volume zone.
The candle has moved up while forming a W pattern, but it is now facing resistance at the volume zone. We need to watch whether it pulls back from here or completes the W pattern.

[4-Hour Chart]
The SMA 200 is moving down and has reached the volume zone, while the candles are gradually making lower lows.
If price continues to make lower lows and touches the volume zone again, I think we need to keep in mind the possibility of a pullback.
If I had entered a long position, I would set the stop-loss area near the volume zone around $62,675.

[1-Hour Chart]
The market appears to be trying to move upward, but there is still fear of a longer-term decline, so having a stop-loss level is essential.
I drew an uptrend line. It connects the previous area where price received moving-average support three times with the current pullback area.
It seems reasonable to either use the volume zone as the stop-loss area or exit if the uptrend line breaks.
[30-Minute Chart]
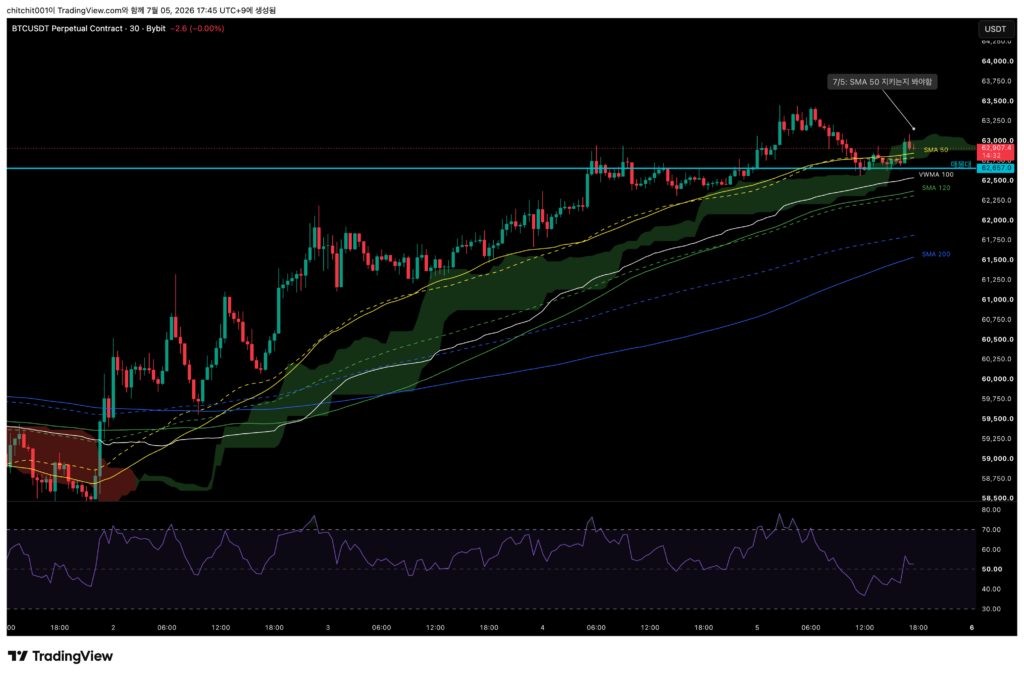
More important than making large profits is minimizing losses.
Here, the SMA 50 seems to be playing an important role. From a more conservative perspective, the SMA 50 could also be used as a stop-loss reference.
I am mentioning stop-loss levels quite a lot today. Some might ask, “Why enter if you are already thinking about cutting the loss?” But I actually prefer situations like this. It is better to test the stones before crossing the bridge, and here there are several stones to test. At the very least, if I do not get greedy, there are multiple points where I can protect myself.
[Ethereum, ETHUSDT.P]
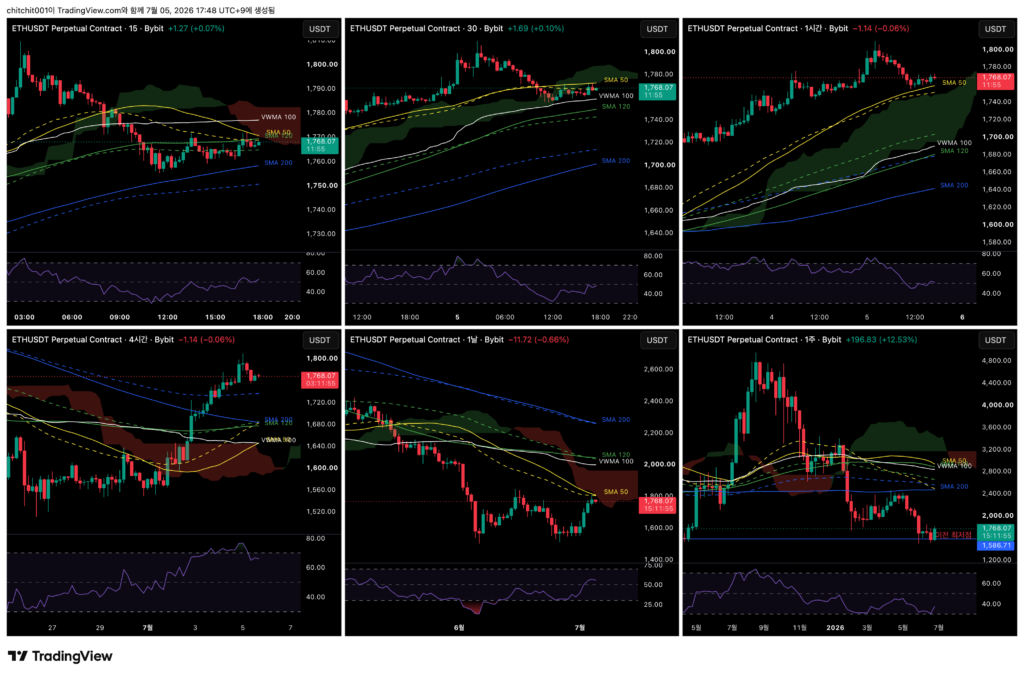
This is the comprehensive Ethereum chart.
- It has been a while since I posted about Ethereum, hasn’t it? During that time, unnecessary greed created a gap between my thoughts and my actions.
- So, with a sense of reflection and discipline, I went back to the basics and studied again.
- Recently, Ethereum has been showing stronger momentum than Bitcoin, so I think it is worth paying attention to. That is why I want to continue writing about it.
- Ethereum’s candles are also currently near moving averages across multiple timeframes, which makes the chart easier to interpret and a useful point for planning entries and exits.
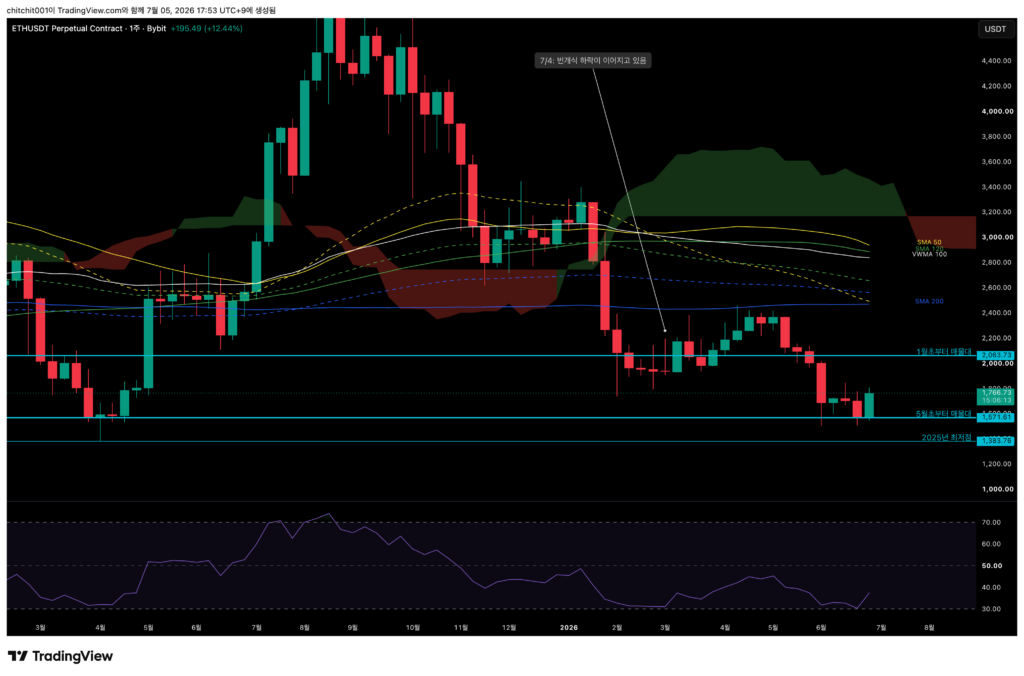
[Weekly Chart]
- I drew several horizontal lines.
- Last week, Ethereum found support around the central area of the volume zone that began forming in early May, and this week it moved up sharply.
- In other words, the price area where buying and selling were most active during the decline that started in May has been passed for now.
- Now, Ethereum is heading toward the next battleground. That area is the volume zone around $2,063, which began forming in January.
- If someone bought from lower levels, it may be worth holding at least until that area. If not, rather than entering for a long hold in an unclear area, waiting for the next volume zone may be the better approach.
- Of course, if someone is scalping based on minute or hourly charts, they would not necessarily need to wait for the volume zone from early January.

[Daily Chart]
- Ethereum has broken above the speed fan that began in May, and it faced resistance once at the SMA 50.
- There is also a thick bearish Ichimoku cloud directly ahead.
- The probability of a pullback looks somewhat higher. But that could also be viewed as an opportunity. I would watch carefully and consider an entry if price touches the speed fan, or more ideally, if it reaches the volume zone that began forming in May.

[4-Hour Chart]
- The SMA 50 and VWMA 100 appear to be preparing for a golden cross.
- Since the gap between the candles and the moving averages is quite wide, some kind of pullback seems unavoidable as they try to meet again.
- Price could pull back. That could be an opportunity, so I want to keep watching closely.

[1-Hour Chart]
- When expecting a pullback, there is one unfavorable scenario: Ethereum could receive support at the SMA 50 on the 1-hour chart.
- Look at the bullish cloud. It is very thick.
- From the longer-term trend perspective, I would like to see one pullback, but on the shorter timeframes, price may continue to grind higher while receiving support.
- If it rises without a pullback, that would be unfortunate, but I would have no choice but to let it go. If the short-term trend breaks and price pulls back, then I would look at that as an opportunity.