This post is simply a personal investment journal based on my own market observations. Please do not take it as investment advice or follow it blindly. Every investment decision is your own responsibility, so please invest carefully and I sincerely hope your decisions lead to successful outcomes.
[Bitcoin, BTCUSDT.P]
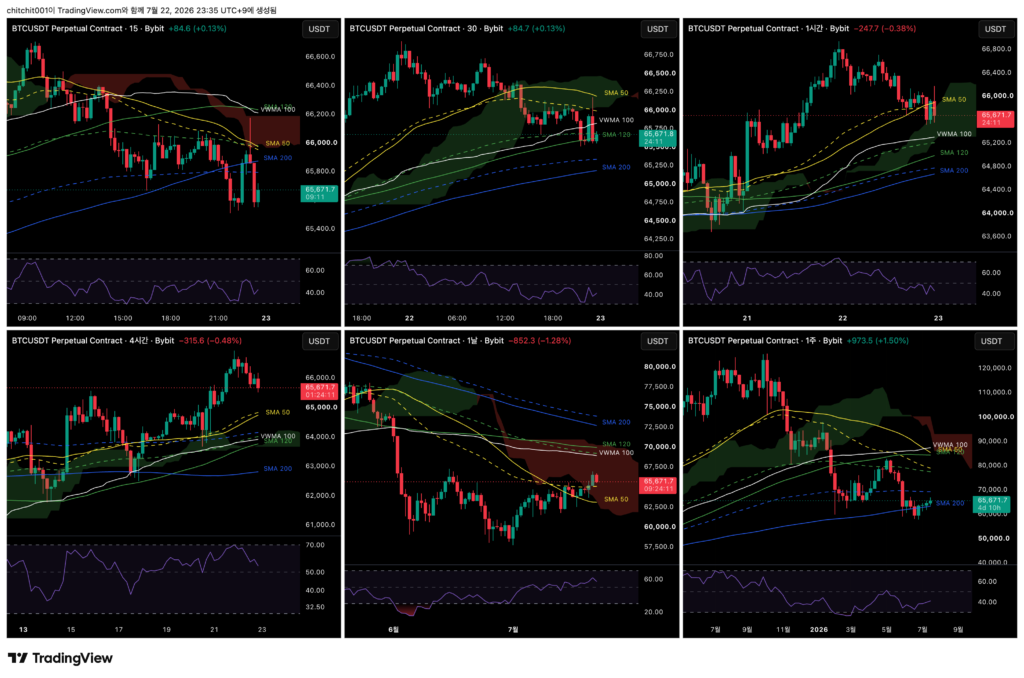
This is the comprehensive Bitcoin chart. From the upper left in a Z-shaped order, the timeframes are the 15-minute, 30-minute, 1-hour, 4-hour, daily, and weekly charts.
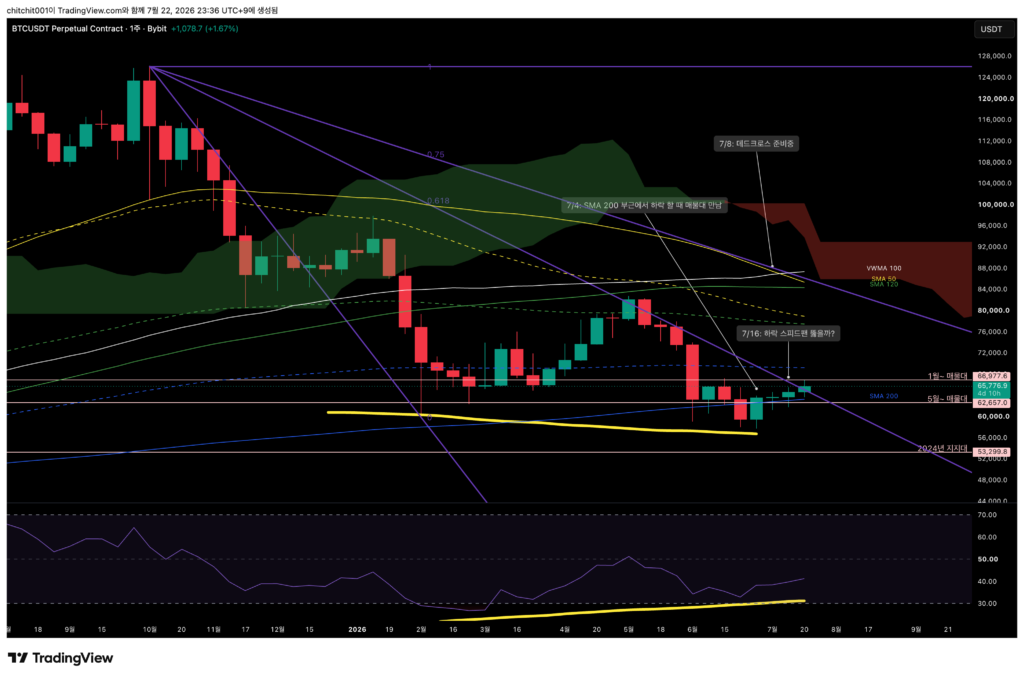
[Weekly Chart]
- The candle is moving around the speed fan. This is an important area and an important moment.
- If I were to take the courage to buy here, I would need to keep the stop-loss tight. If I can be patient, it may also be better to wait for this week’s weekly close before making a decision.
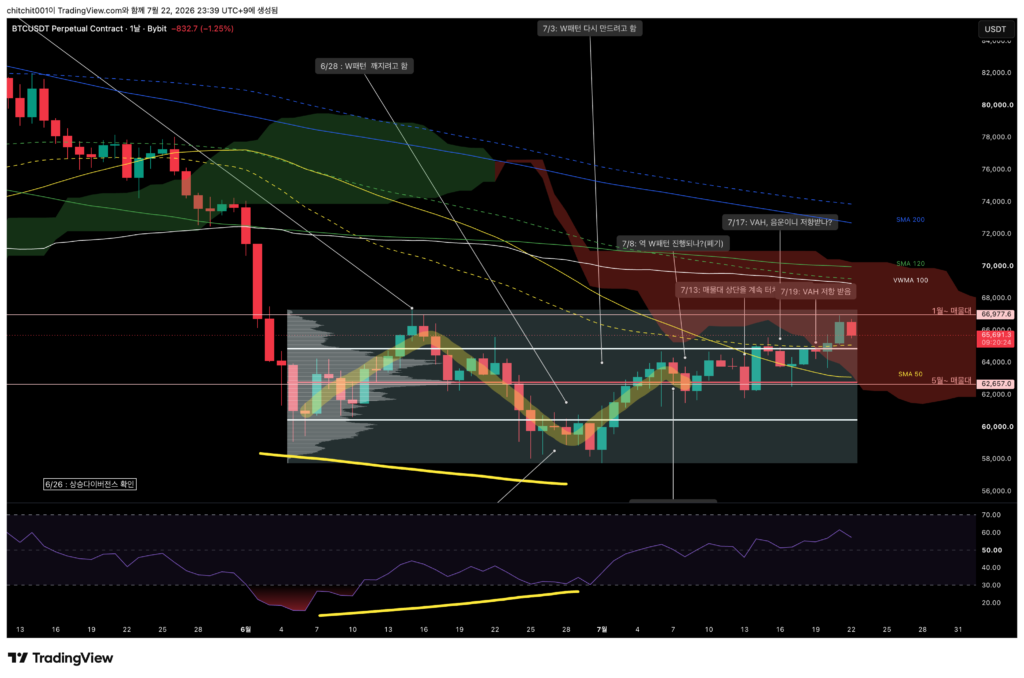
[Daily Chart]
- Yesterday, a large bullish candle appeared. Its upper wick slightly touched the center of the volume zone that began in January. In other words, price has started to test that area.
- Today, however, it failed to reach that level and has slipped lower.
- Since it has touched the area once, there is a good chance it may try again. I think it is necessary to wait for that moment and respond accordingly.
- When price passes through the center of the volume zone, quickly chasing the move with a tight stop-loss could also be worth considering.
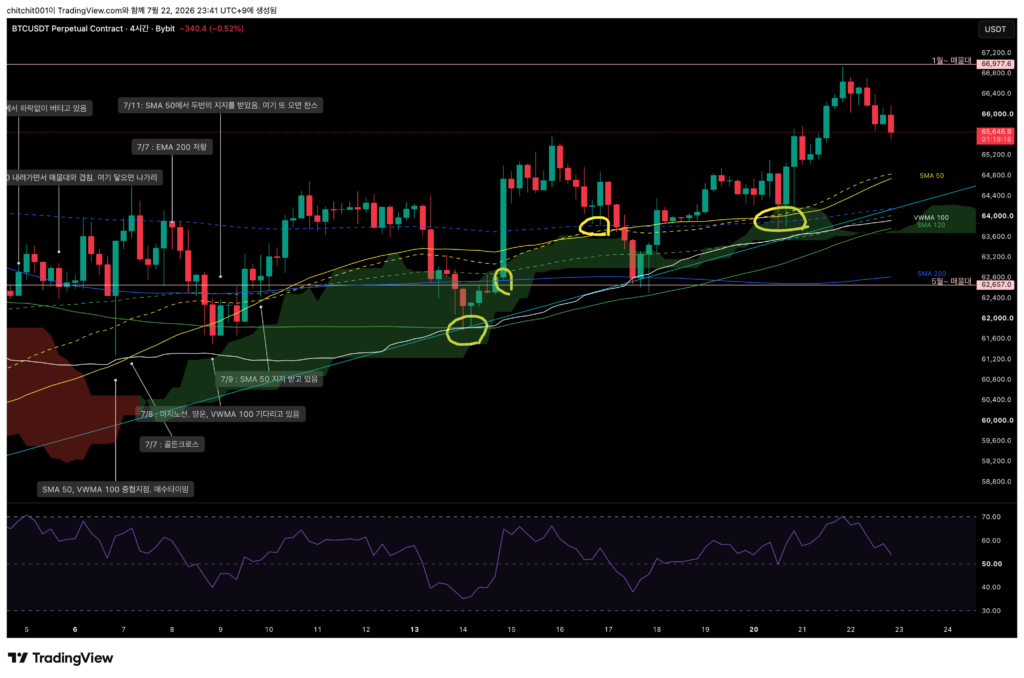
[4-Hour Chart]
- At the current position, it is difficult to form any particular view.
- The gap from the candles is also quite large.

[1-Hour Chart]
- Small movements continued for a while, but over the past three hours, large roller-coaster-like moves have appeared.
- This is the kind of situation where retail traders can easily get shaken out. Entering too hastily is not a good idea.
[Ethereum, ETHUSDT.P]
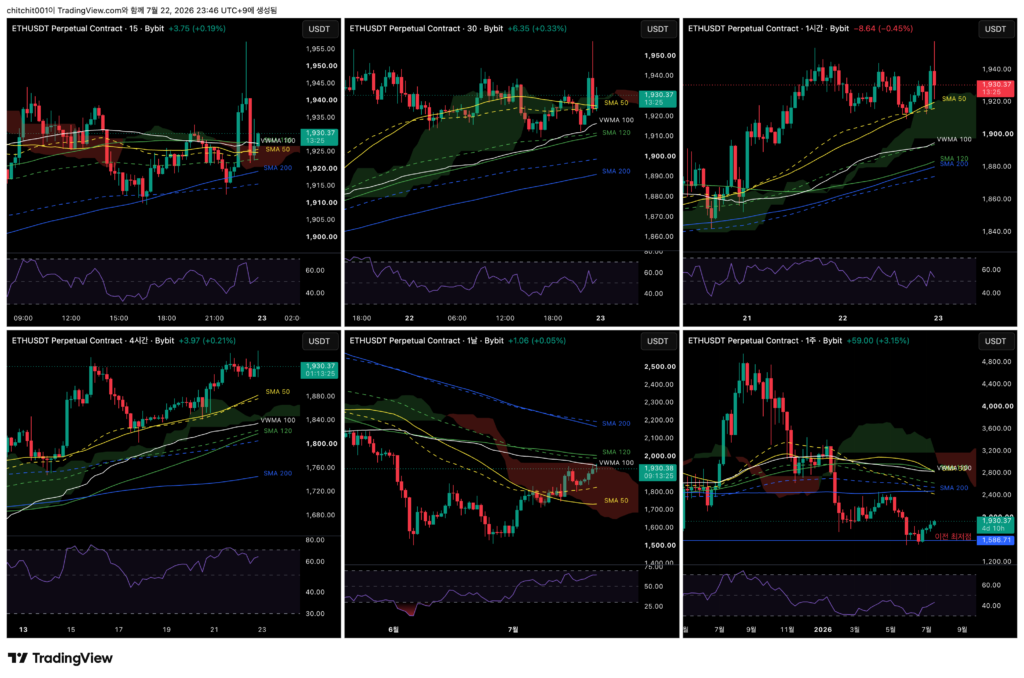
This is the comprehensive Ethereum chart.
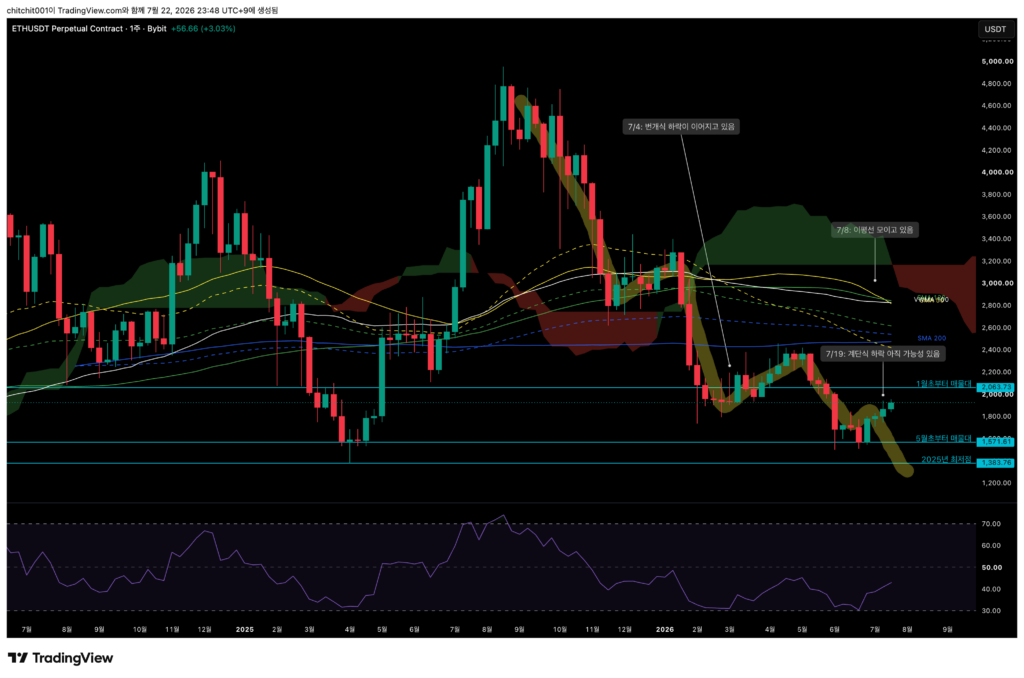
[Weekly Chart]
- Compared to Bitcoin, Ethereum is maintaining a relatively better flow.
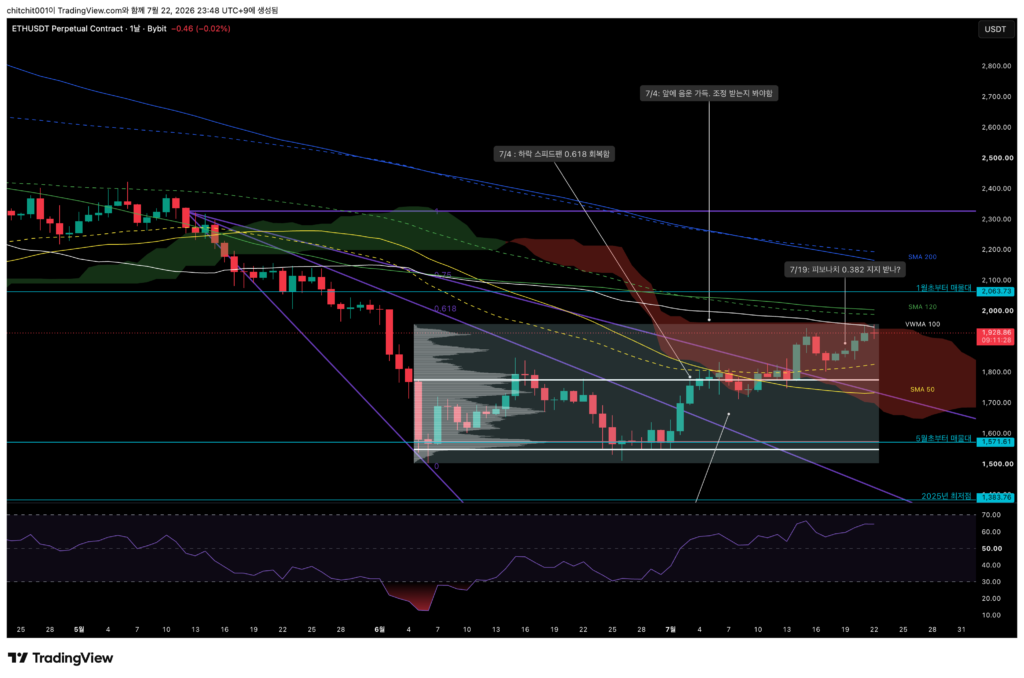
[Daily Chart]
- Ethereum has reached the upper end of the sideways volume zone.
- It has also touched the VWMA 100.
- This is an important crossroads: will it face resistance here, or break through this area and move toward a new high?
- For Ethereum, I need to watch this week’s weekly close carefully as well, but for a different reason than Bitcoin.

[4-Hour Chart]
- Ethereum has received support from the SMA 50 four times.
- If I wanted to trade Ethereum, it may be reasonable to keep only the 4-hour chart open and consider entering when price touches the SMA 50.
- Of course, this alone should not be treated as the only basis for expecting further upside.
- But viewed from the opposite angle, it is also strong evidence that price is being supported, so entering with a tight stop-loss could be considered.

[1-Hour Chart]
- Ethereum is receiving support from the SMA 50, but the pattern is weaker compared to the 4-hour chart.
- Since it is forming long wicks both above and below, I think it is better not to enter at the current point.