This post is simply a personal investment journal based on my own market observations. Please do not take it as investment advice or follow it blindly. Every investment decision is your own responsibility, so please invest carefully and I sincerely hope your decisions lead to successful outcomes.
[Bitcoin, BTCUSDT.P]
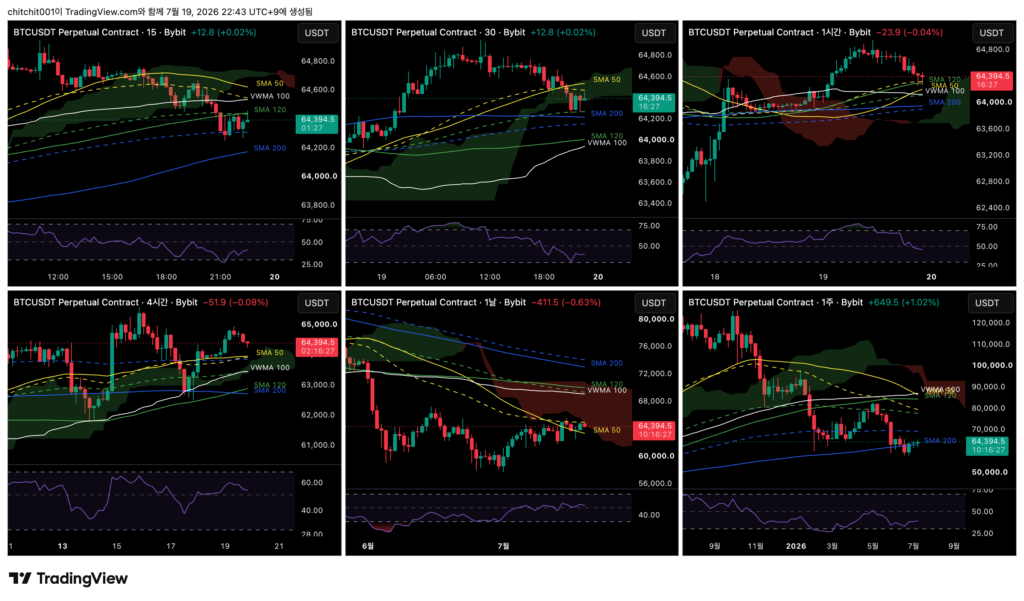
This is the comprehensive Bitcoin chart.

[Weekly Chart]
- Bitcoin is moving toward the 0.618 level of the speed fan.
- Ideally, it would be better for price to rise and touch the speed fan with upward momentum. However, in the current situation, it looks more likely to touch it while moving sideways. If that happens, it would be difficult to say that Bitcoin has truly broken through.
- At the moment, price is sitting between the volume zones that began in January and May, so this is a difficult area to interpret.
[Daily Chart]
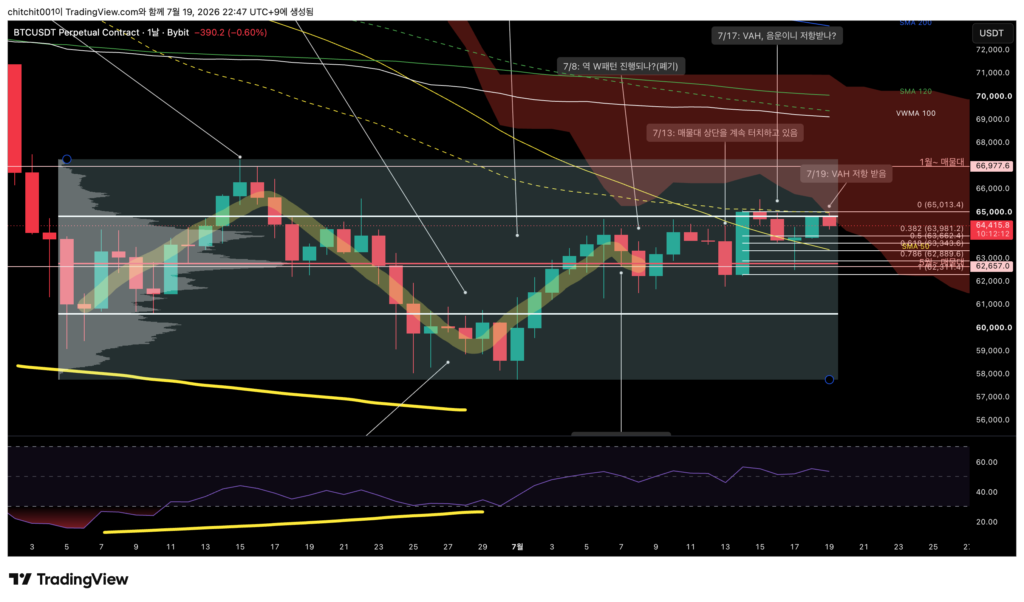
- Bitcoin continues to face resistance at the upper 70% area of the volume zone, the VAH.
- Since price is being blocked here and repeatedly moving sideways, this is a difficult area to stay involved in.
[4-Hour Chart]
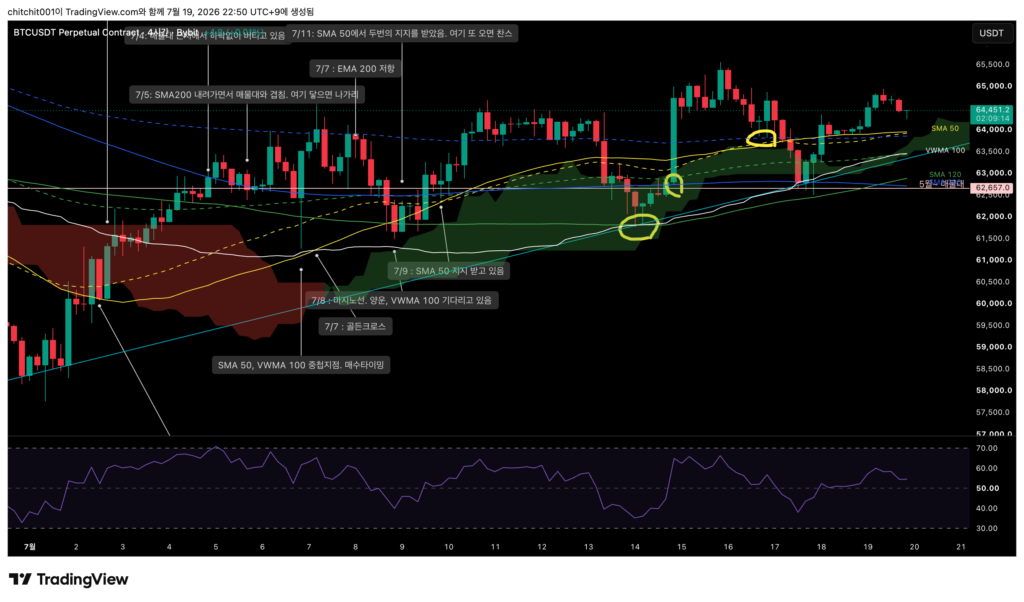
- As mentioned earlier, Bitcoin has been moving sideways for a long time, so it is somewhat ambiguous to analyze anything right now.
- Also, each candle is moving only around 0.1% to 0.2%, so I find myself wondering whether it is even worth analyzing just to capture such a small move.
- That is also why I have not written for the past few days.
[Ethereum, ETHUSDT.P]

This is the comprehensive Ethereum chart.
- Like Bitcoin, Ethereum has also been continuing to move sideways.
- The range of both upward and downward moves is so small that it is difficult to do much with it.
- At this point, I do not think chart analysis has much meaning.