This post is a personal investment journal based on my own market study and observations. It is not financial advice or a recommendation to buy or sell any asset. Each investor is responsible for their own investment decisions, so please make careful decisions based on your own judgment and risk tolerance.
[Bitcoin, BTCUSDT.P]
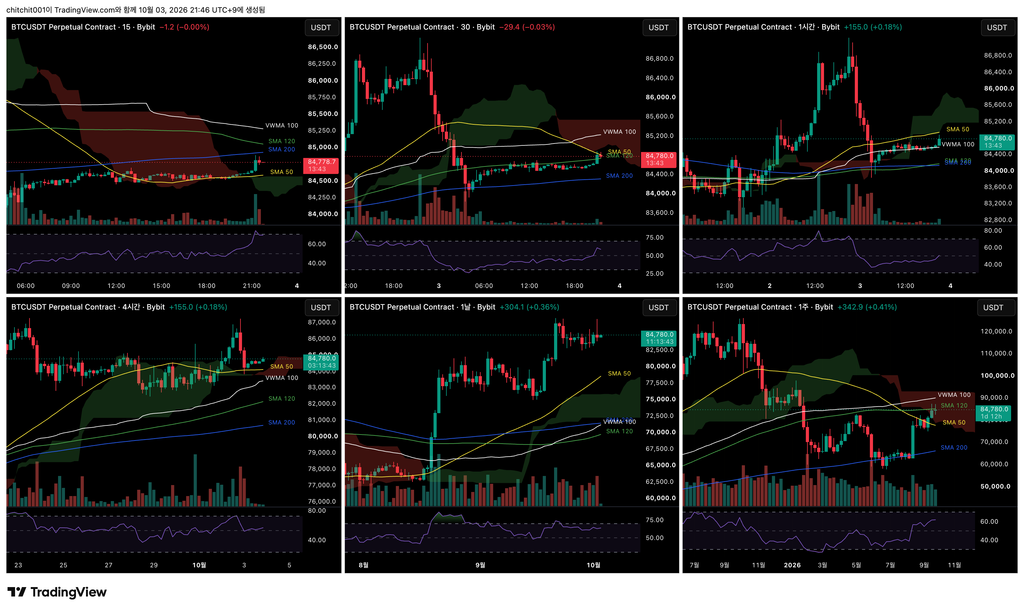
This is a multi-timeframe overview of Bitcoin. Starting from the upper left and following a Z-shaped order, the charts show the 15-minute, 30-minute, 1-hour, 4-hour, daily, and weekly timeframes.
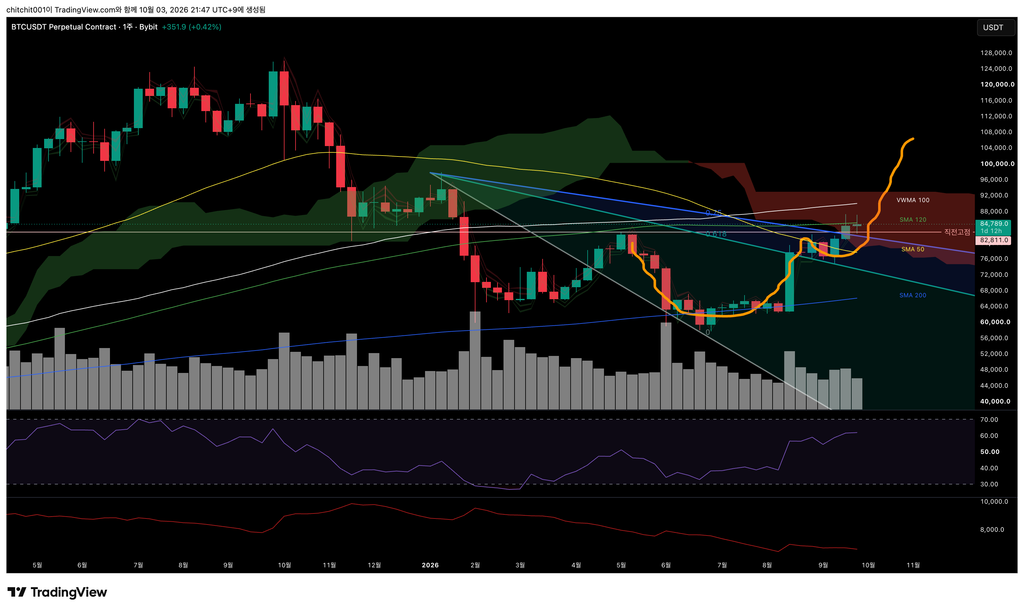
[Weekly Chart]
- Bitcoin is moving sideways this week. The weekly candle is still bullish, but the gain is modest.
- The bearish Ichimoku cloud ahead appears to be limiting upward momentum.
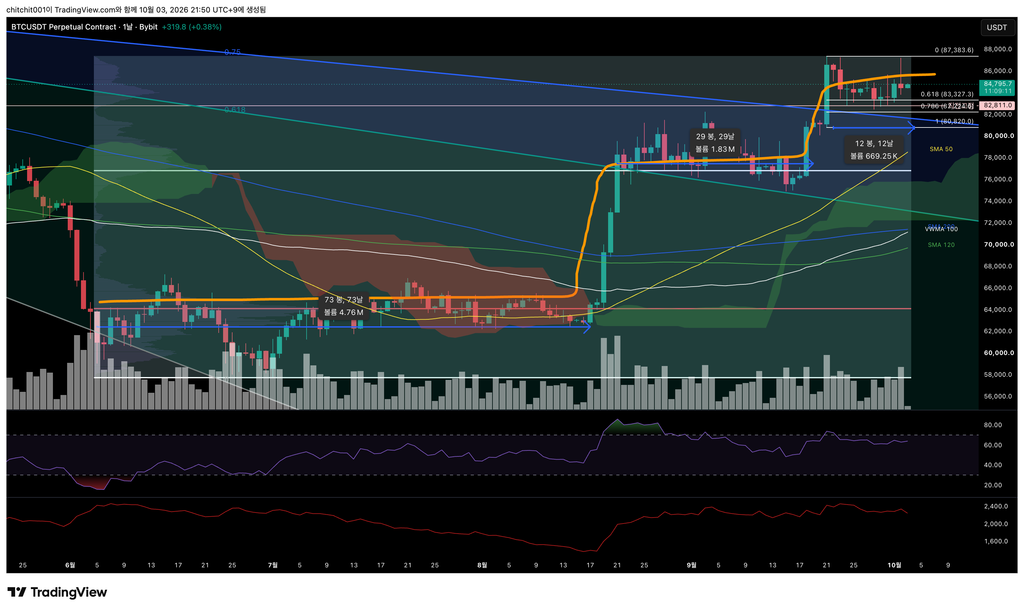
[Daily Chart]
- Look at the orange line: consolidation, a rally, another consolidation, another rally, and now another period of consolidation.
- The first consolidation lasted 73 days, and the second lasted 29 days. These periods are becoming progressively shorter, while the current consolidation has lasted 12 days so far. Given this pattern, I wonder whether another significant move may be approaching.
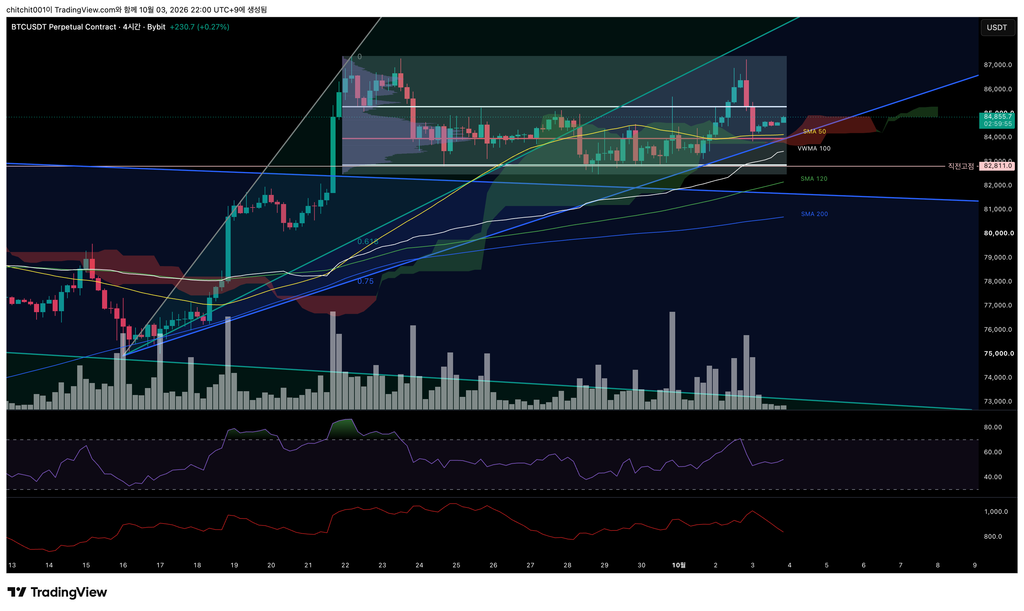
[4-Hour Chart]
- Price has been consolidating while holding above the volume profile’s VAL. More recently, it has also been holding above the POC.
- The absence of a significant breakdown gives me some hope for another move higher. If the RSI cools further, I plan to look for a possible entry.
[Ethereum, ETHUSDT.P]
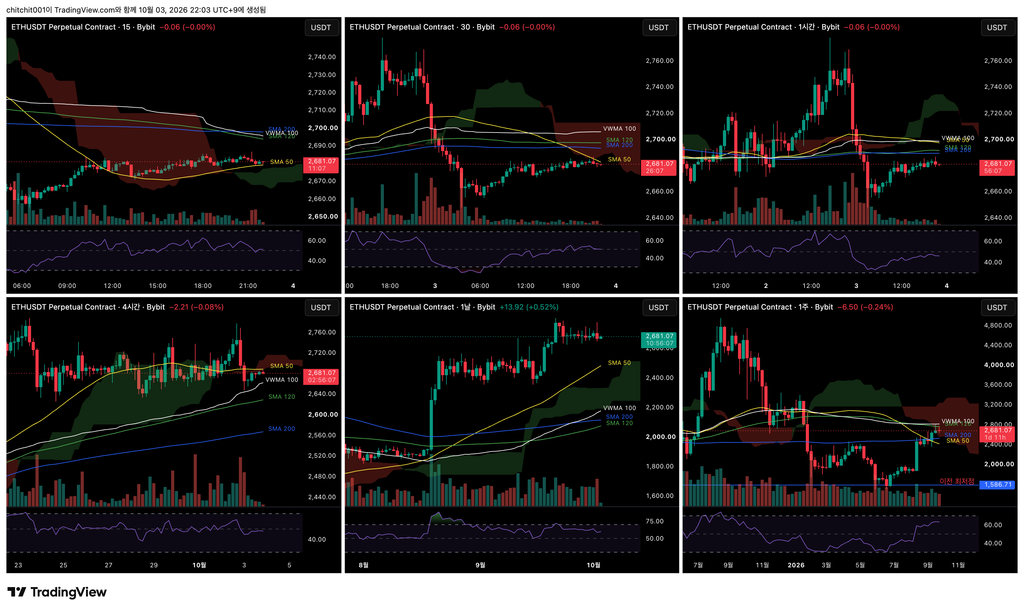
This is a multi-timeframe overview of Ethereum.
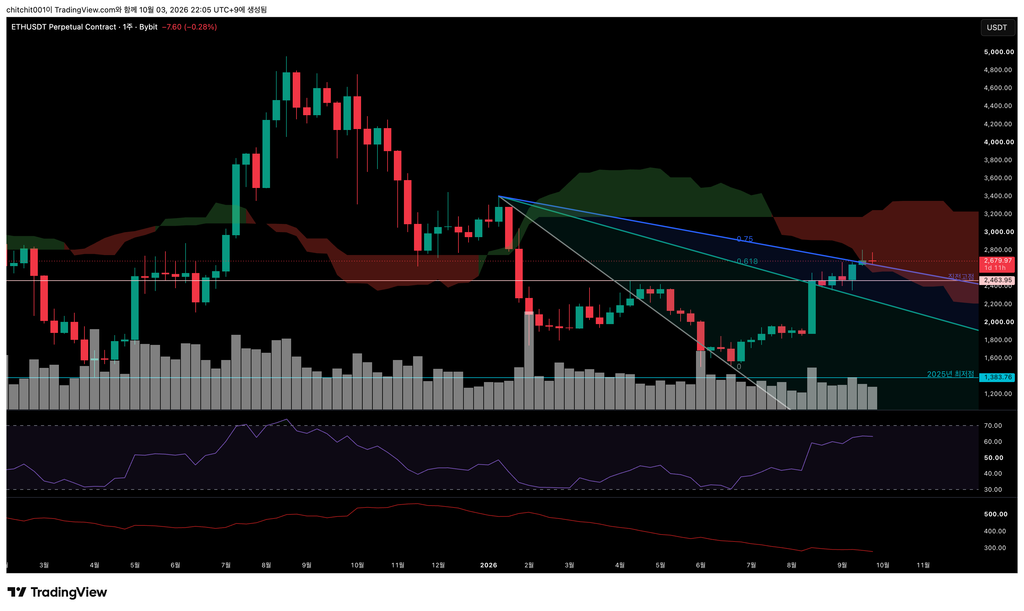
[Weekly Chart]
- Like Bitcoin, Ethereum is holding above the 0.75 level of the Speed Fan, with a thick bearish Ichimoku cloud ahead.
- I would like to see price break decisively through the bearish cloud, but the overhead resistance is still holding it back.
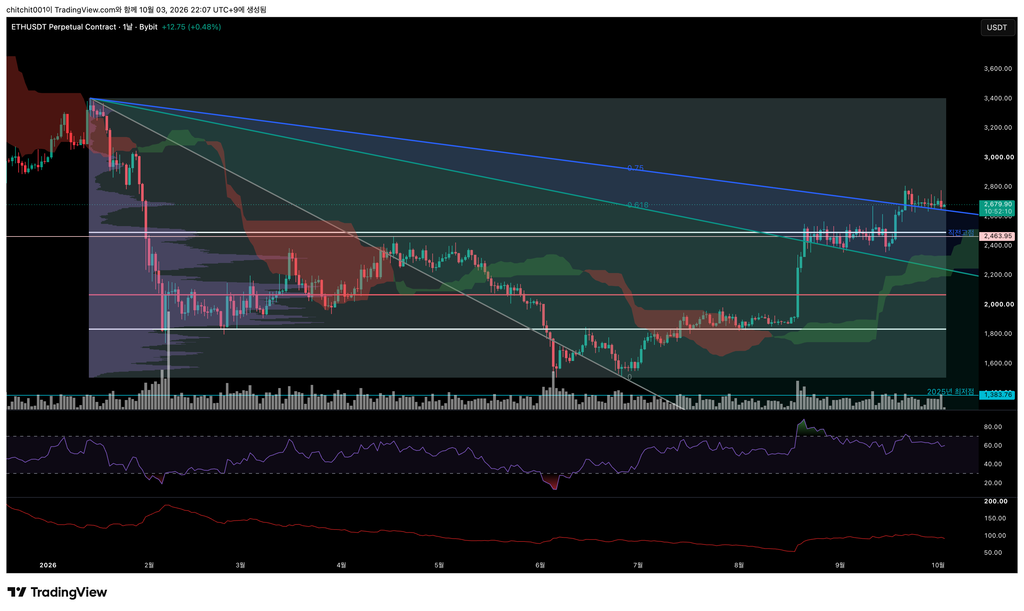
[Daily Chart]
- Price has already moved above all the marked volume zones, so they do not appear particularly relevant at the moment.
- As with Bitcoin, I plan to consider a position once the RSI cools.