This post is simply a personal investment journal based on my own market observations. Please do not take it as investment advice or follow it blindly. Every investment decision is your own responsibility, so please invest carefully and I sincerely hope your decisions lead to successful outcomes.
[Bitcoin, BTCUSDT.P]
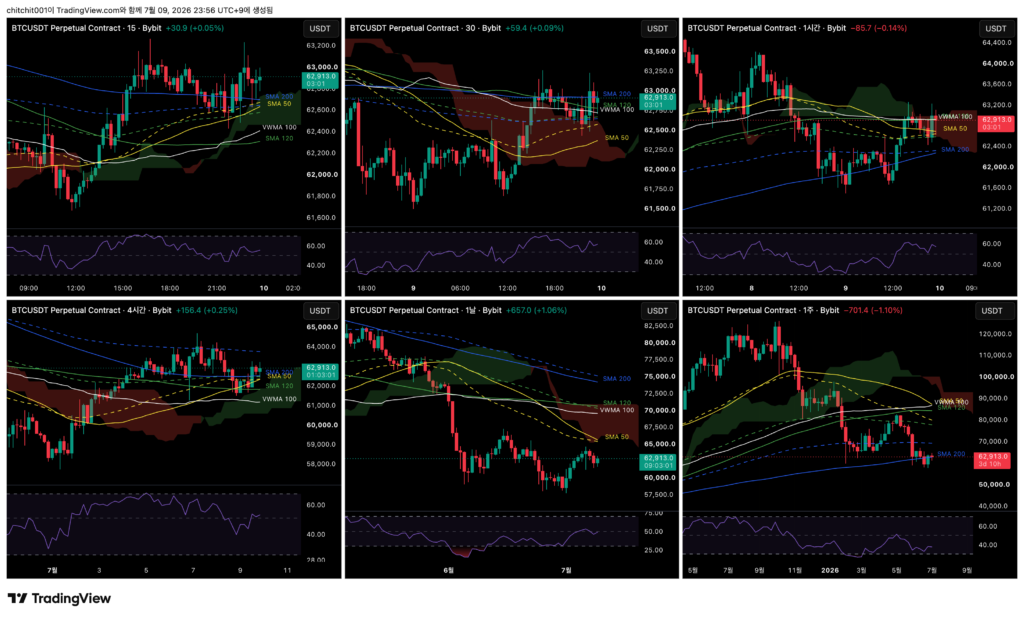
This is the comprehensive Bitcoin chart. From the upper left in a Z-shaped order, the timeframes are the 15-minute, 30-minute, 1-hour, 4-hour, daily, and weekly charts.
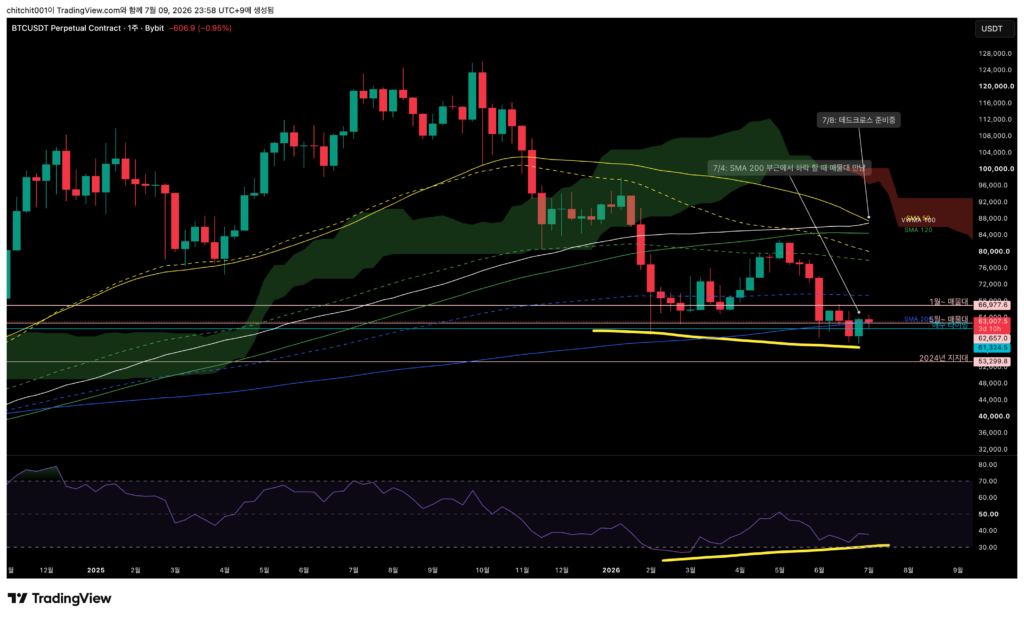
[Weekly Chart]
- Bitcoin rebounded more than 1% today, leaving the weekly candle with a long lower wick.
- It continues to receive persistent support around the SMA 200 without breaking down.
- Still, this does not yet look like a market where I would feel comfortable betting on a long-term uptrend.
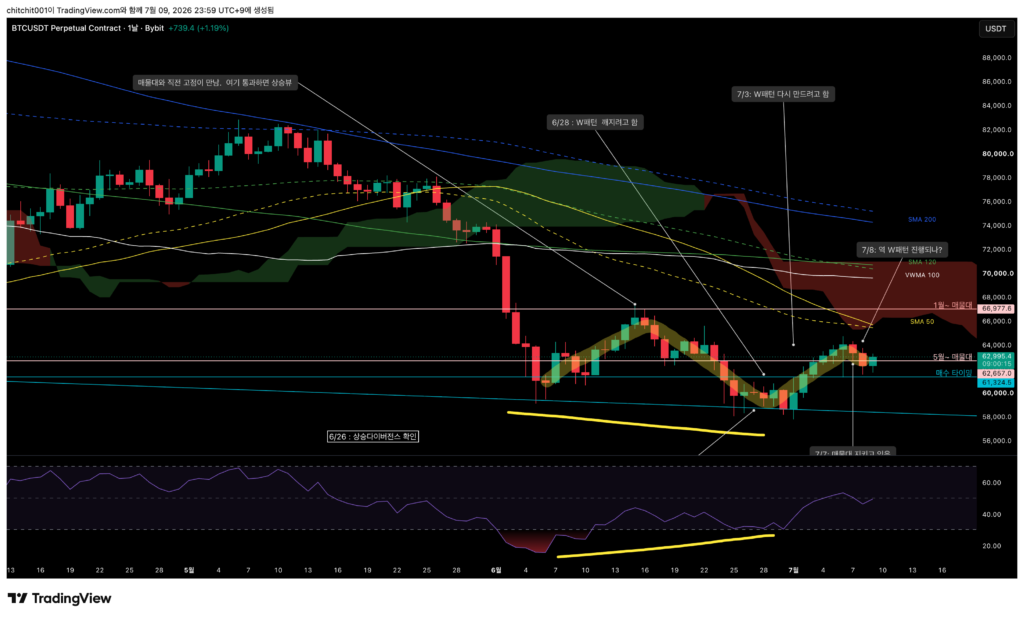
[Daily Chart]
- Yesterday, I was quite concerned that Bitcoin might form an inverse W pattern, but for now, it is holding up relatively well today.
- Price continues to move sideways around the volume zone from the decline that began in May. For now, I think it is better to wait and observe.
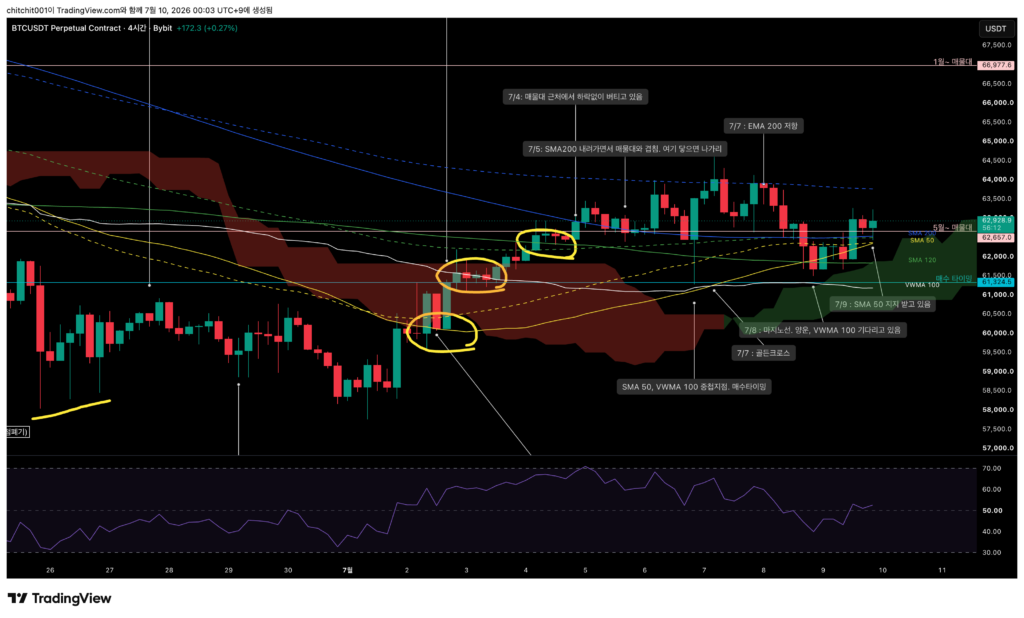
[4-Hour Chart]
- Bitcoin continues to move higher while receiving support around the SMA 50.
- Nearby, several moving averages such as the SMA 200 and EMA 50/120 are clustered together. It looks reasonable to wait until price breaks clearly in one direction and then respond from there.
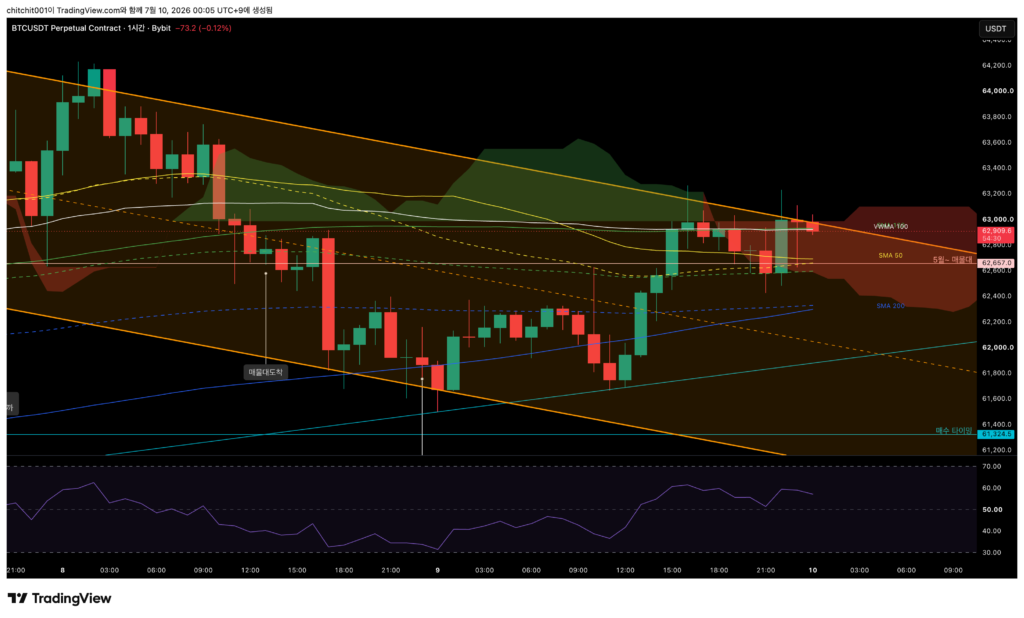
[1-Hour Chart]
- There are quite a lot of lines here. For now, price is moving sideways around the VWMA 100 and SMA 120.
- As mentioned in the longer timeframes, the moving averages are currently converging. In other words, the market seems to be preparing for a directional move. It is difficult to predict which direction it will be, so I would rather respond after the move happens.
[Ethereum, ETHUSDT.P]
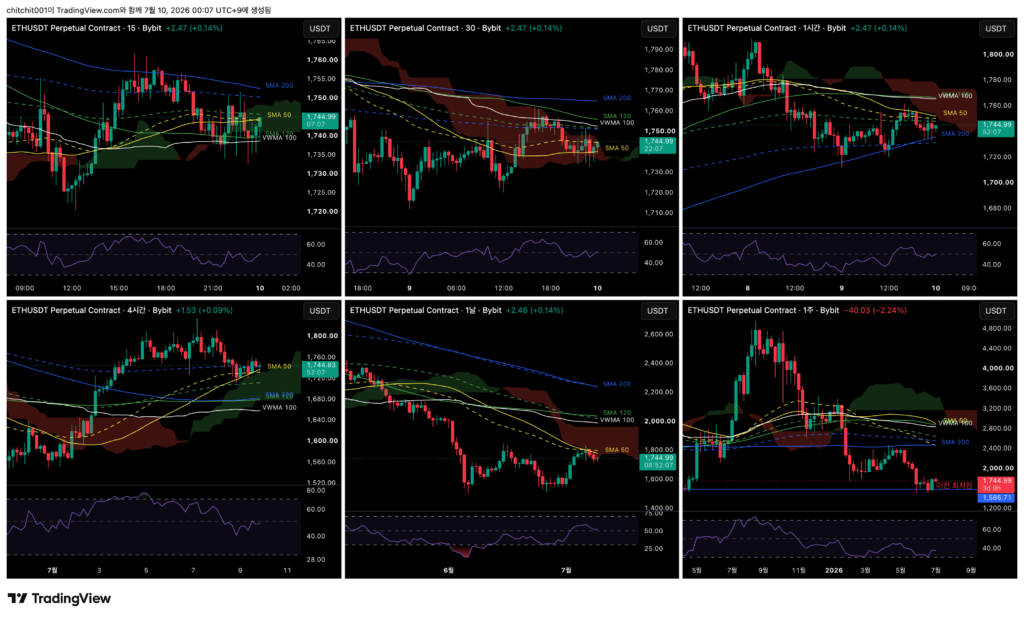
This is the comprehensive Ethereum chart.
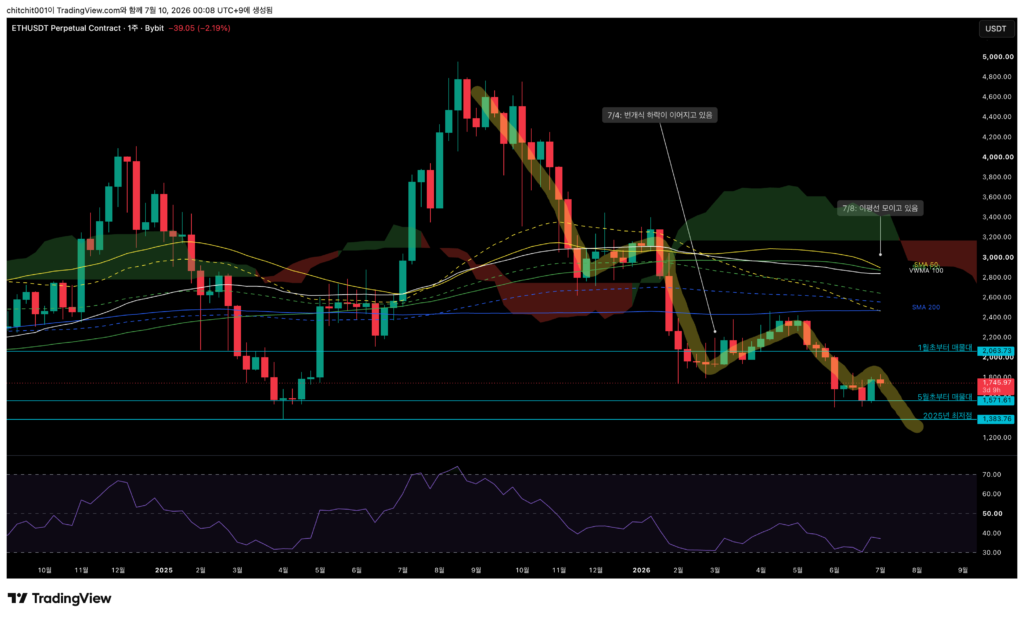
[Weekly Chart]
- There is nothing particularly different compared to yesterday.
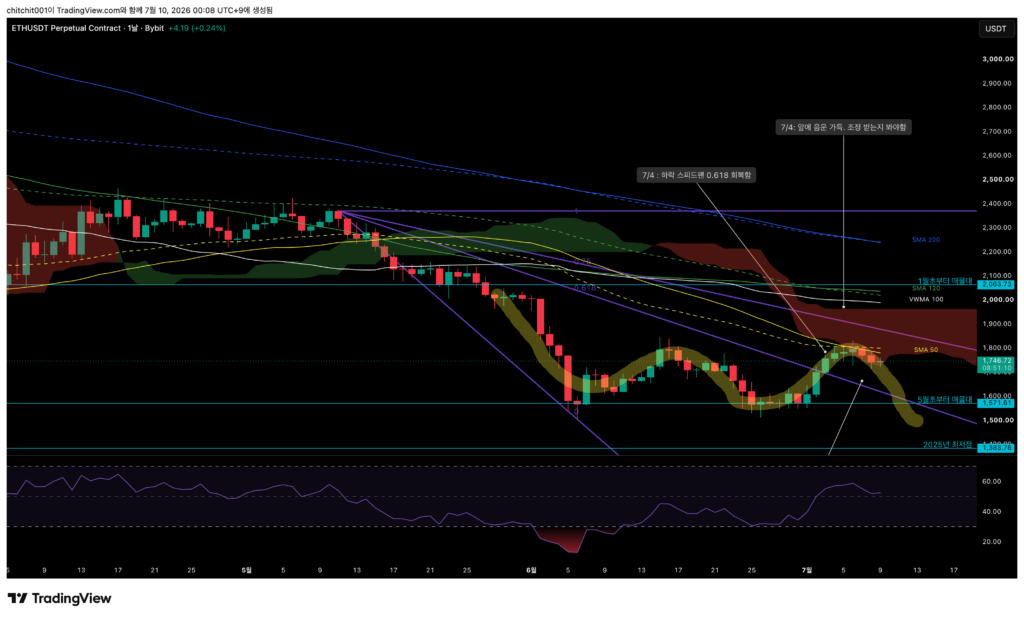
[Daily Chart]
- Ethereum is facing resistance at the SMA 50. I am curious to see whether today’s bullish candle can break through that level.
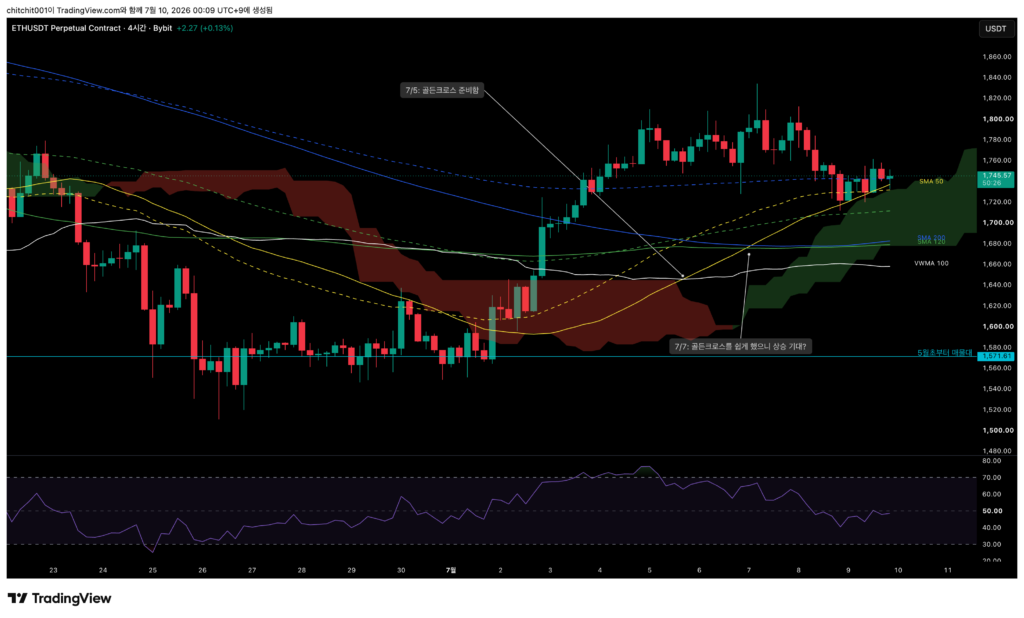
[4-Hour Chart]
- Ethereum continues to receive support from the SMA 50. When looking at this together with the daily chart, the ideal picture would be for Ethereum to keep rising while holding the SMA 50 on the 4-hour chart, and then eventually break above the SMA 50 on the daily chart as well.
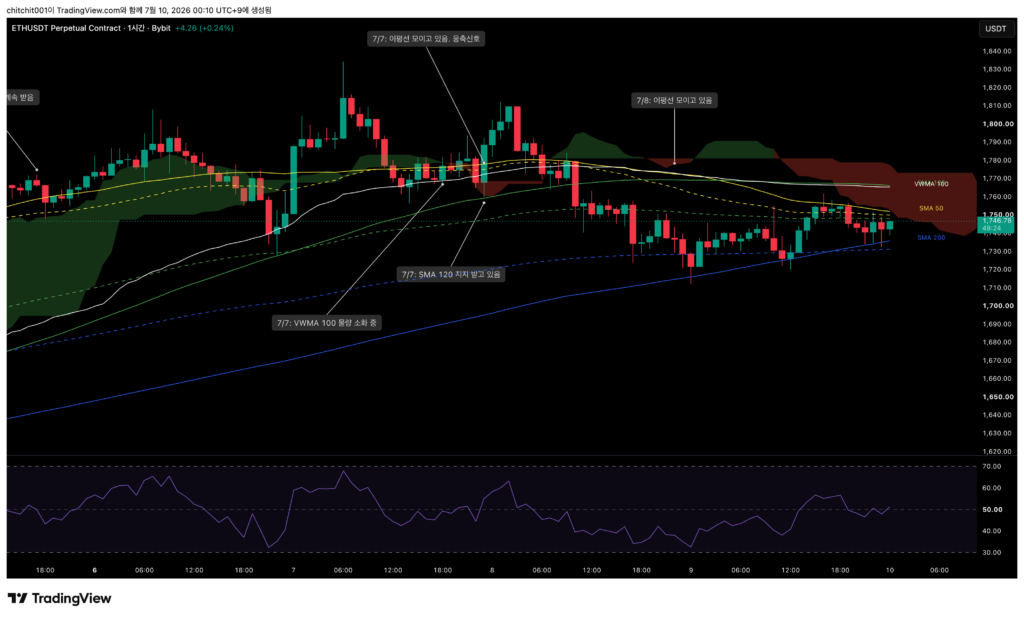
[1-Hour Chart]
- Ethereum is rebounding after finding support almost perfectly around the SMA 200.
- However, there are still many moving averages above that it needs to break through, so I think it is better to approach this while being prepared for at least one short-term pullback.