This post is simply a personal investment journal based on my own market observations. Please do not take it as investment advice or follow it blindly. Every investment decision is your own responsibility, so please invest carefully and I sincerely hope your decisions lead to successful outcomes.
[Bitcoin, BTCUSDT.P]
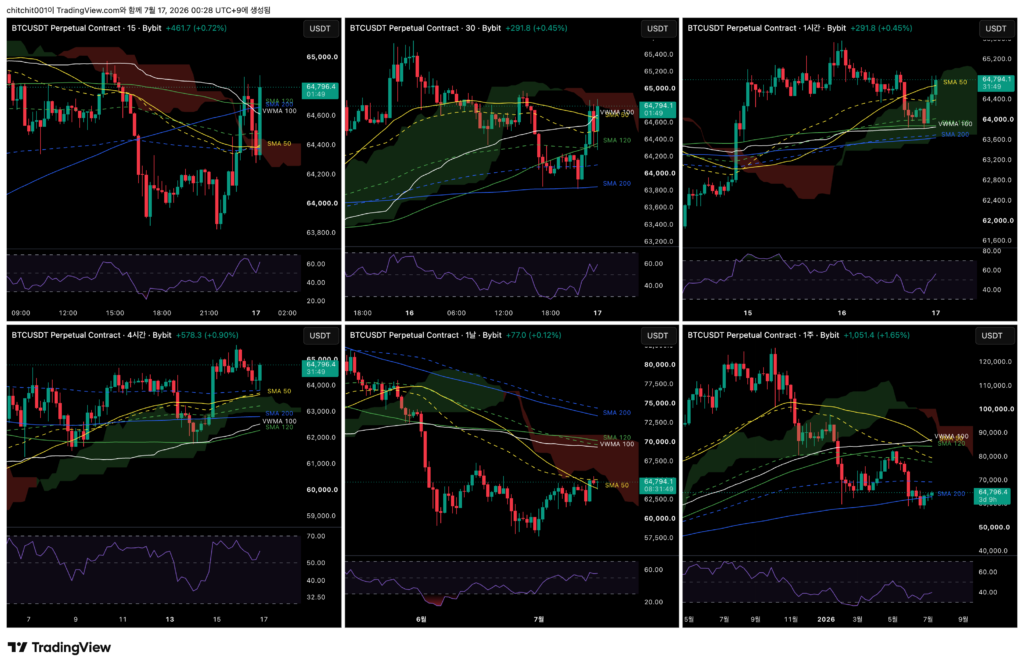
This is the comprehensive Bitcoin chart. From the upper left in a Z-shaped order, the timeframes are the 15-minute, 30-minute, 1-hour, 4-hour, daily, and weekly charts.

[Weekly Chart]
- Bitcoin is forming a bullish candle with a long lower wick. Since it is still forming a bullish candle for the third consecutive week, this remains a positive signal.
- It should reach the 0.618 area of the downward speed fan soon, so I want to watch it until then. If it breaks through that level, I would consider a buying opportunity.
[Daily Chart]
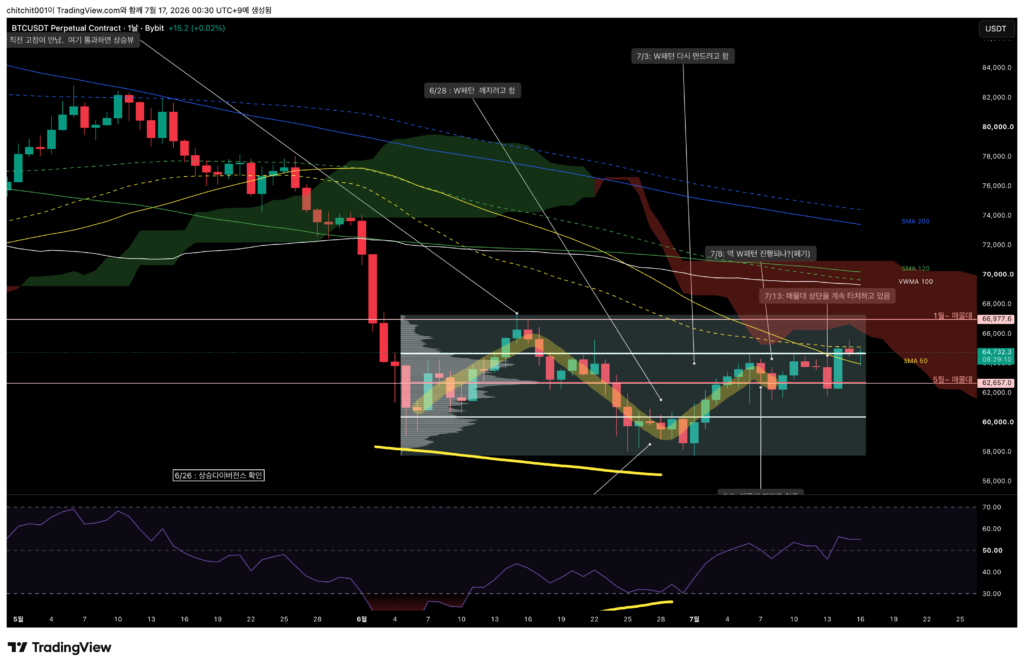
- Price continues to move sideways around the upper 70% area of the volume zone.
- Ideally, it would be better to see one pullback from here before moving higher. Since there is also a bearish cloud ahead, I think the probability of that scenario may be a bit higher.
[4-Hour Chart]
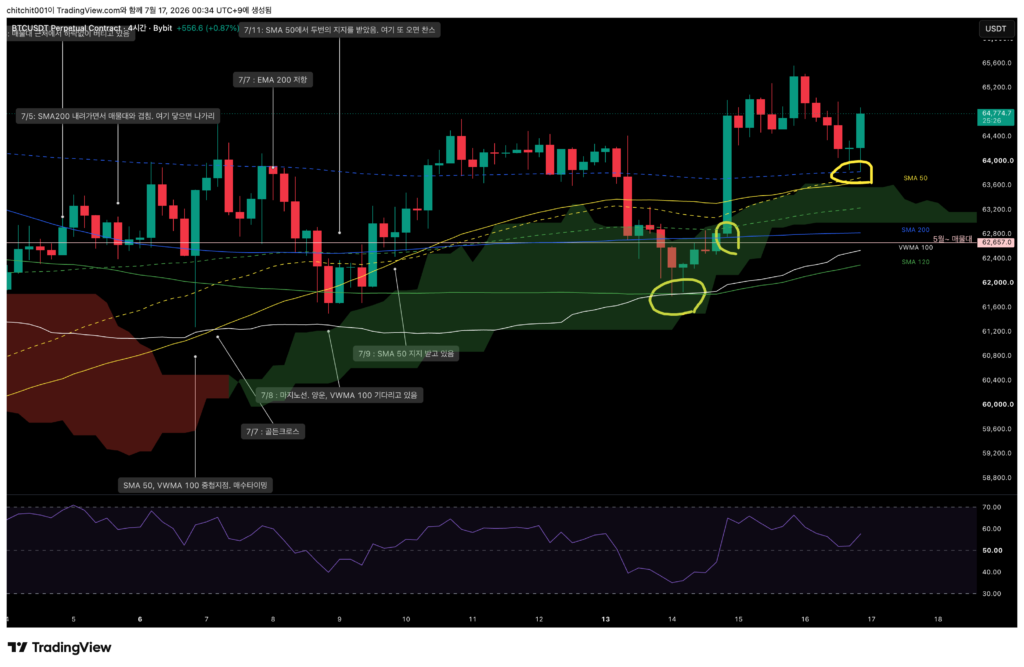
- Look at the yellow circles. Bitcoin is receiving very precise support from the moving averages.
- At the moment, price has already touched the final moving average, the EMA 200, and moved higher from there, so there is no additional support line below. In other words, it is difficult to buy too hastily here. The best point would have been when price touched the EMA 200.
[1-Hour Chart]
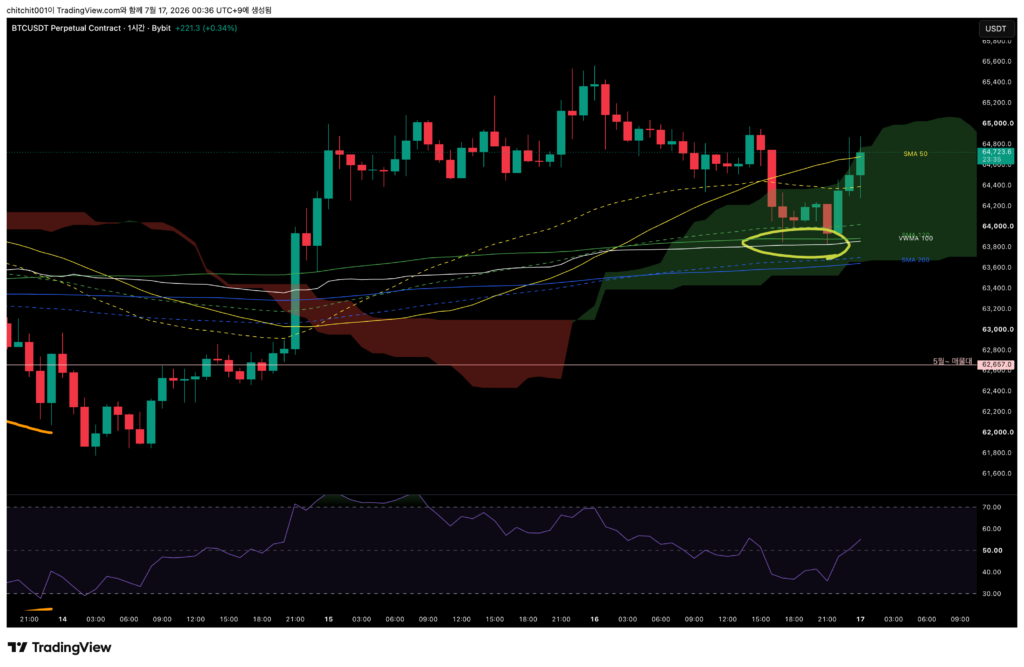
- Look at the yellow circles. Recently, Bitcoin has been respecting the moving averages quite well. For the time being, I think it is worth trusting the moving averages.

[15-Minute Chart]
- A W pattern appeared. This evening turned out to be a good buying point.
- At the moment, however, price is showing large volatility without a clear direction, so I do not think this is a good timing for entry.
[Ethereum, ETHUSDT.P]
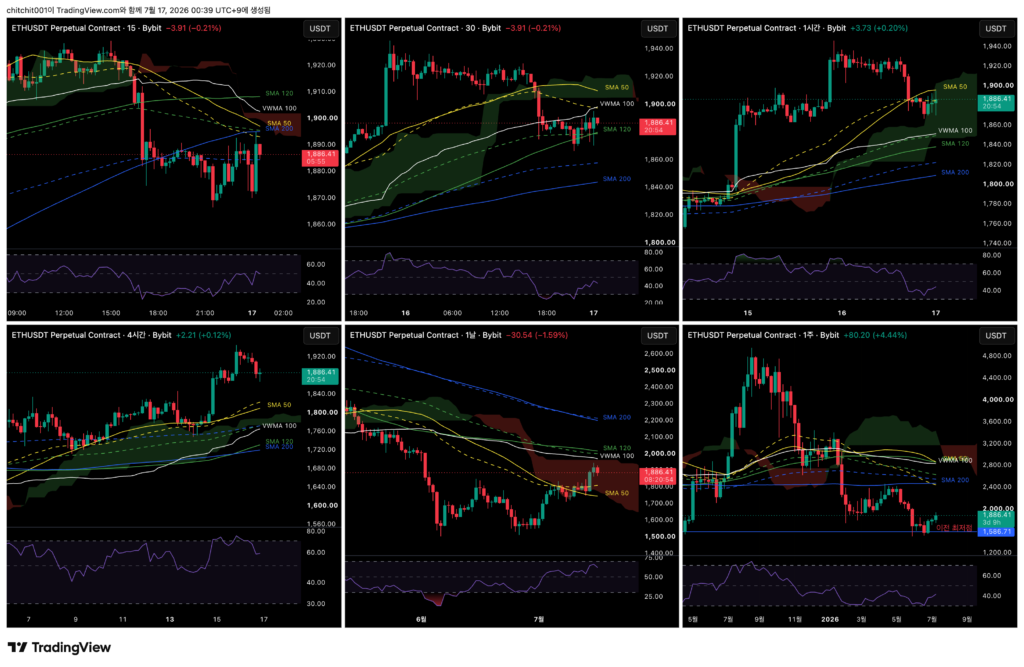
This is the comprehensive Ethereum chart.

[Weekly Chart]
- Unlike Bitcoin, Ethereum is forming a bullish candle with both upper and lower wicks. Compared to Bitcoin, Ethereum appears to have relatively more downside pressure.
[Daily Chart]
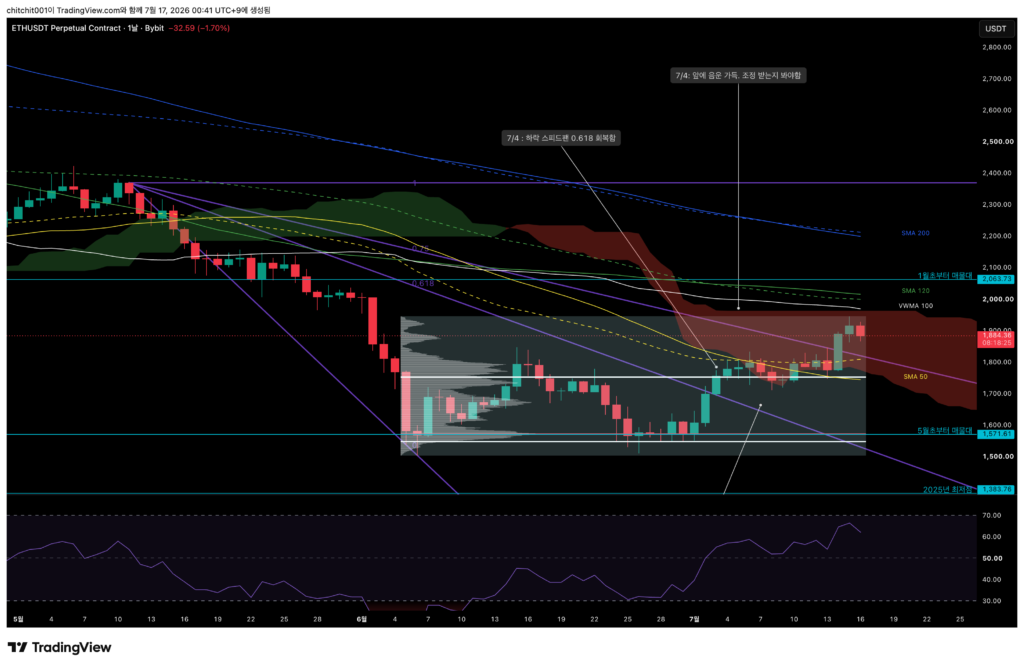
- As expected, Ethereum is showing a bearish candle today. It broke above the speed fan, but if it is now forming a bearish candle while sitting inside the bearish Ichimoku cloud, then I also need to consider the possibility of longer-term downside.
- However, as mentioned yesterday, Ethereum has also broken above the VAH area of the volume zone, so I do not expect the decline to be very deep.

[4-Hour Chart]
- Look at the areas marked in yellow. Ethereum received strong support twice near the SMA 50. If price comes back to the SMA 50 again, I need to keep in mind that it may find support there once more.
- I also drew Fibonacci levels on the large bullish candle. Price roughly moved while using the key levels as support and resistance. Since price has now moved below the opening price of that large bullish candle, analyzing the Fibonacci levels is probably no longer necessary.
[1-Hour Chart]
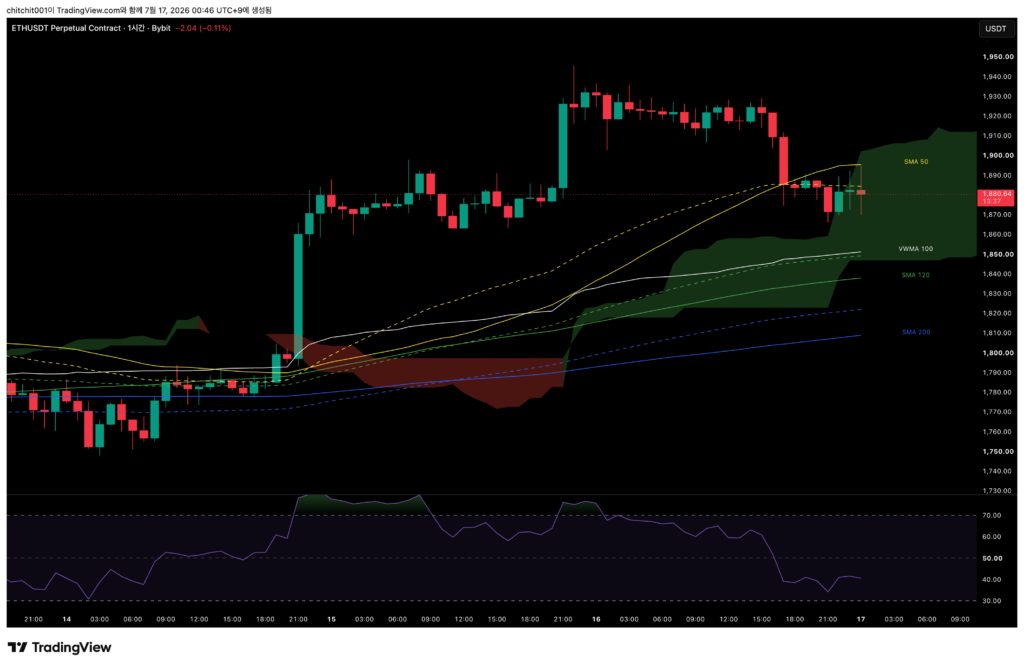
- The candles are in an ambiguous area. This is a difficult zone to interpret.