This post is simply a personal investment journal based on my own market observations. Please do not take it as investment advice or follow it blindly. Every investment decision is your own responsibility, so please invest carefully and I sincerely hope your decisions lead to successful outcomes.
[Bitcoin, BTCUSDT.P]
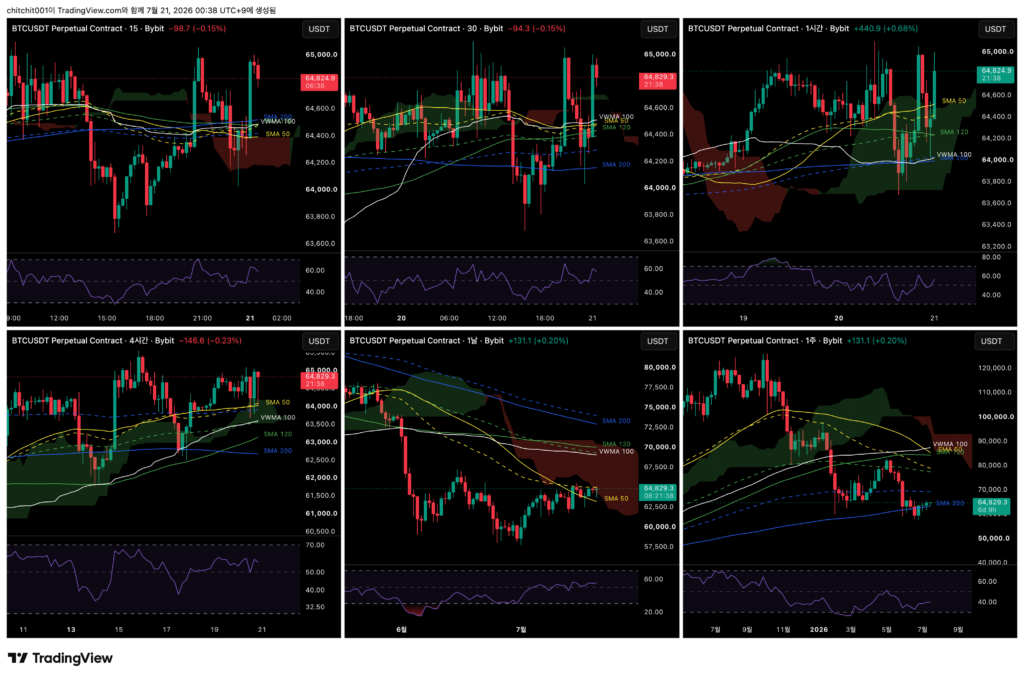
This is the comprehensive Bitcoin chart. From the upper left in a Z-shaped order, the timeframes are the 15-minute, 30-minute, 1-hour, 4-hour, daily, and weekly charts.

[Weekly Chart]
- Bitcoin has reached the 0.618 level of the speed fan. It is also receiving support from the SMA 200, so this is an important point.
- Today’s decline lasted for quite a while, but price has been rising since the evening. If the upward momentum remains strong and Bitcoin moves above the speed fan by around tomorrow, I think a buying opportunity could be considered.

[Daily Chart]
- Bitcoin has broken above the upper area of the volume zone, the VAH, once again. Since it touched that level, pulled back, and then touched it again, I think the probability of breaking through it may be a bit higher this time.

[4-Hour Chart]
- Bitcoin appears to be receiving support from the moving averages quite well.
- At the moment, price has broken above all of the moving averages. If a pullback comes and price touches the moving averages, I think it would be better to view it as a possible support area rather than immediately assuming it will break below them.

[1-Hour Chart]
- There was quite a lot of volatility today. Price moved sharply both up and down, and at the time of writing, a large bullish candle has also appeared.
- For short-term traders, these larger moves can actually be better. Right now, price is far above the moving averages, so I think it is better to watch and wait for a pullback.
[Ethereum, ETHUSDT.P]

This is the comprehensive Ethereum chart.
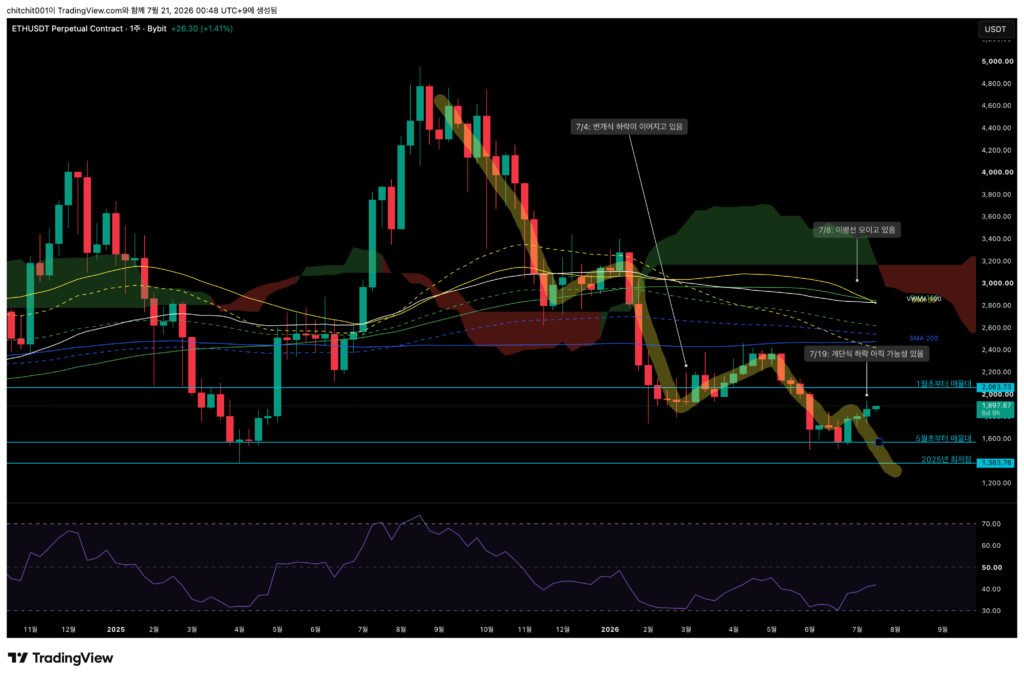
[Weekly Chart]
- I am still not sure whether this is a step-like decline or a move that is breaking out of that pattern and turning upward.
- Whatever the case, four consecutive weeks of upward movement looks positive for now.

[Daily Chart]
- After breaking above the 0.75 level of the speed fan, Ethereum has continued its upward trend.
- It is also showing another strong move higher today.

[4-Hour Chart]
- Look at the yellow circles. Ethereum is respecting the moving averages very well.
- If a pullback comes and price reaches near the SMA 50, I think that is an area where a buying opportunity should be considered.
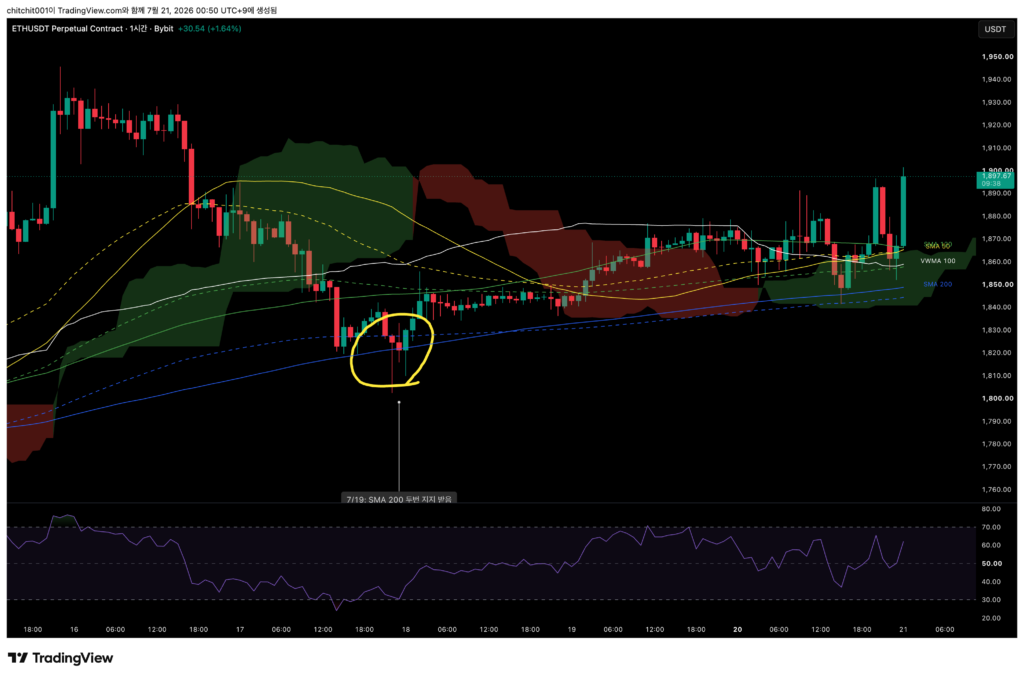
[1-Hour Chart]
- Over the weekend, Ethereum showed only very small fluctuations, but today it has been repeatedly surging and dropping sharply.
- If the flow can be read well, this kind of area can be good for capturing profit. Since price has already risen significantly, the next step is to wait for a pullback.