This post is a personal investment journal based on my own market study and observations. It is not financial advice or a recommendation to buy or sell any asset. Each investor is responsible for their own investment decisions, so please make careful decisions based on your own judgment and risk tolerance.
[Bitcoin, BTCUSDT.P]
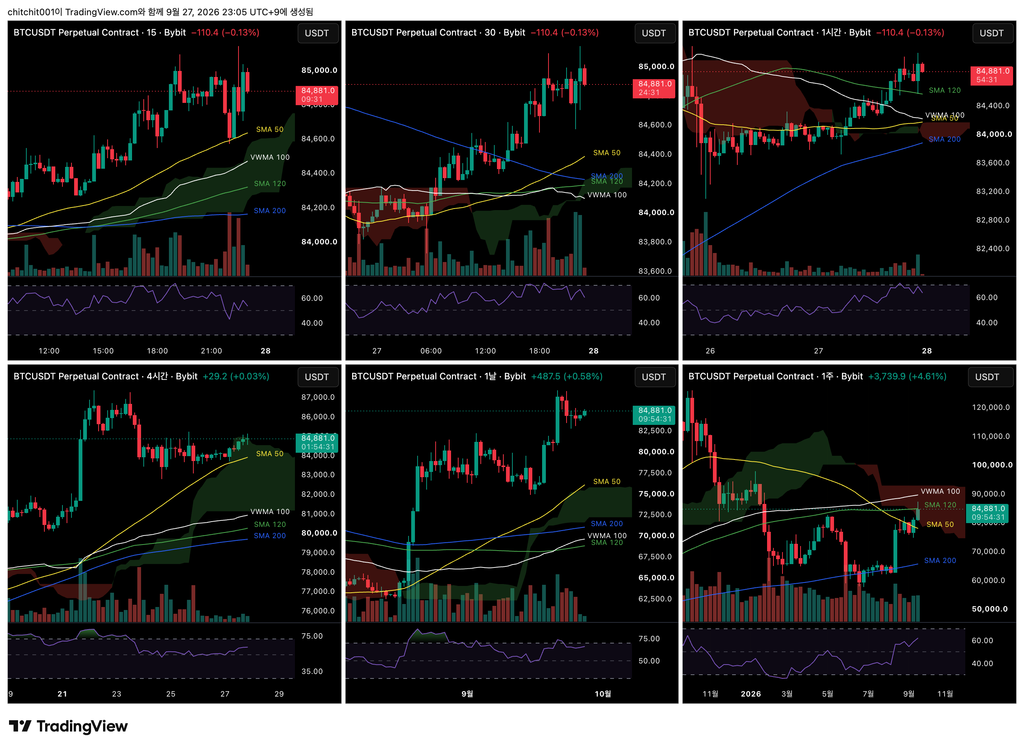
This is a multi-timeframe overview of Bitcoin. Starting from the upper left and following a Z-shaped order, the charts show the 15-minute, 30-minute, 1-hour, 4-hour, daily, and weekly timeframes.
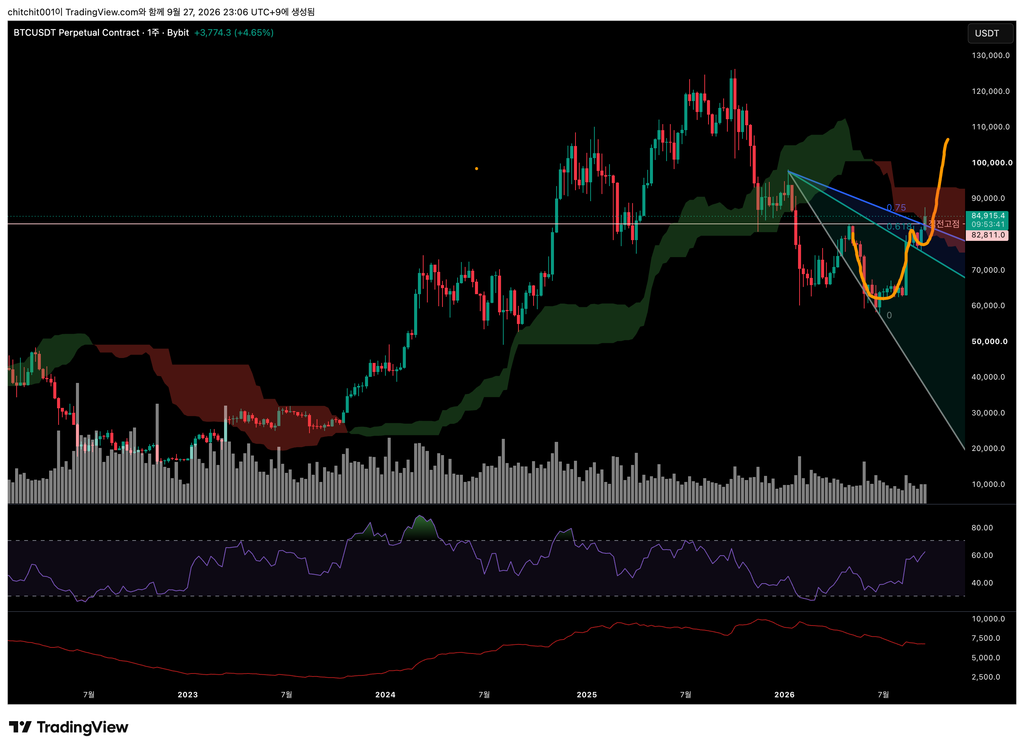
[Weekly Chart]
- Today is the final day of the weekly candle, and the market is rising. The candle’s body now retains more than half of its gains. If it closes at this level tomorrow at 9:00 a.m., price will have broken above the 0.75 level of the Speed Fan. Although a bearish Ichimoku cloud still lies ahead, the market appears to have cleared a major hurdle, suggesting that bullish momentum may begin to strengthen.
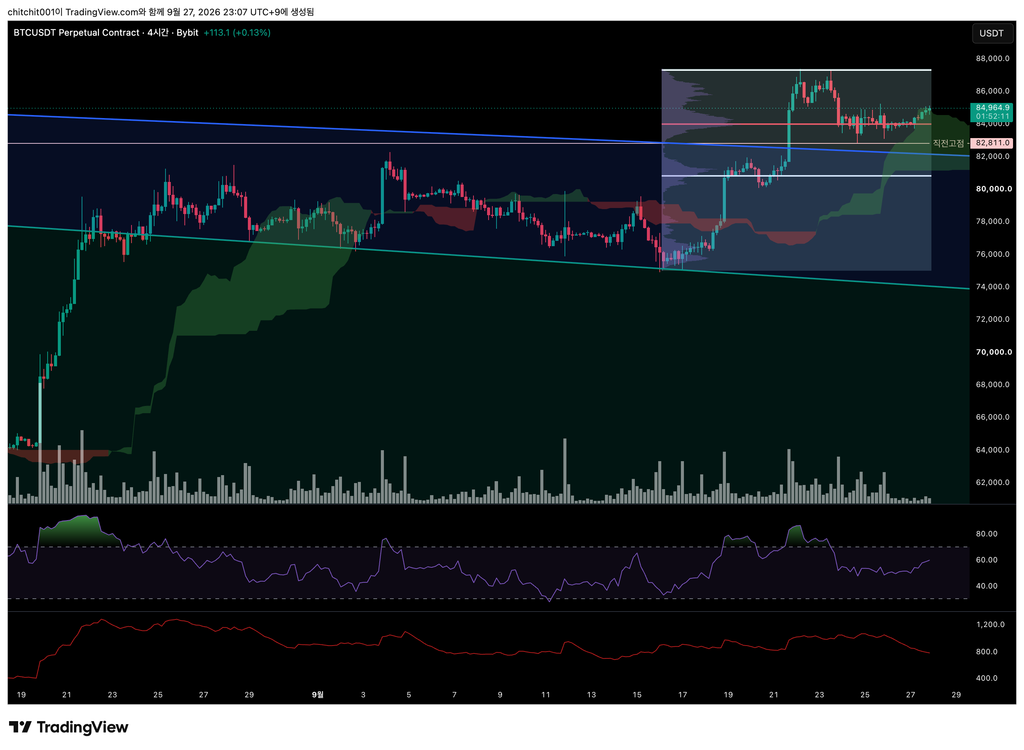
[[4-Hour Chart]
- Price held precisely at the volume profile’s POC and is now moving higher. Unless a sharp decline occurs, the overall picture looks positive so far.
- The RSI has also undergone a reasonable correction, leaving room for another move higher.
- The one drawback is that trading volume remains relatively low.
In my previous post, I wrote that this might be a time to take a calculated risk. Anyone who entered around the POC should currently be in profit. However, it remains essential to have a stop-loss in place.
[Ethereum, ETHUSDT.P]
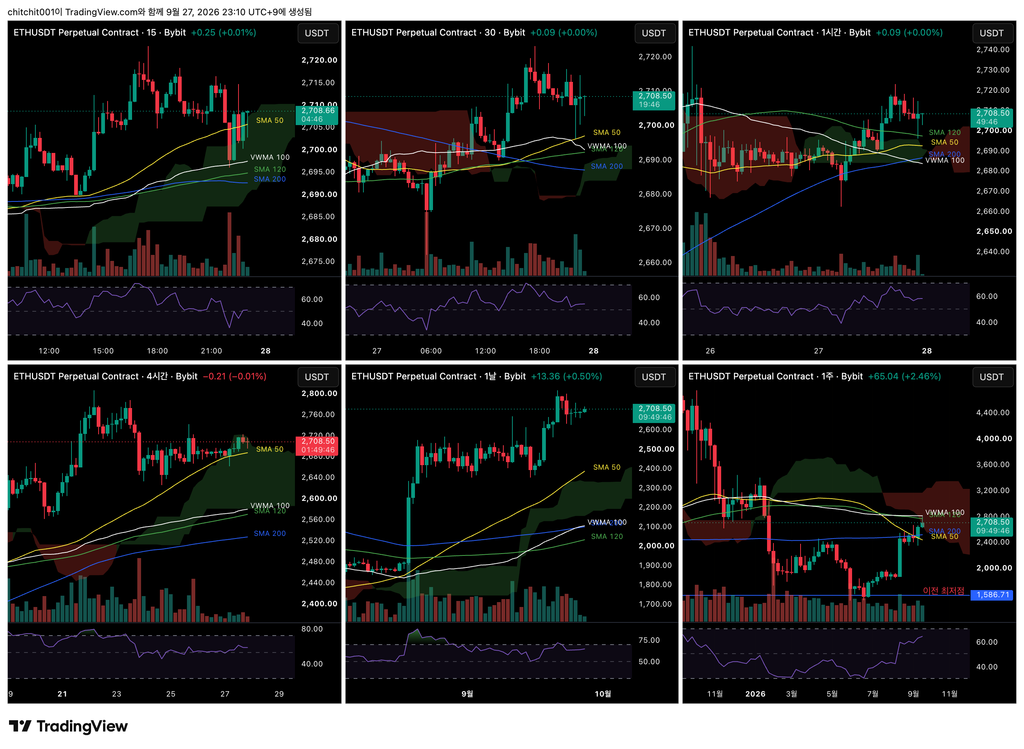
This is a multi-timeframe overview of Ethereum.
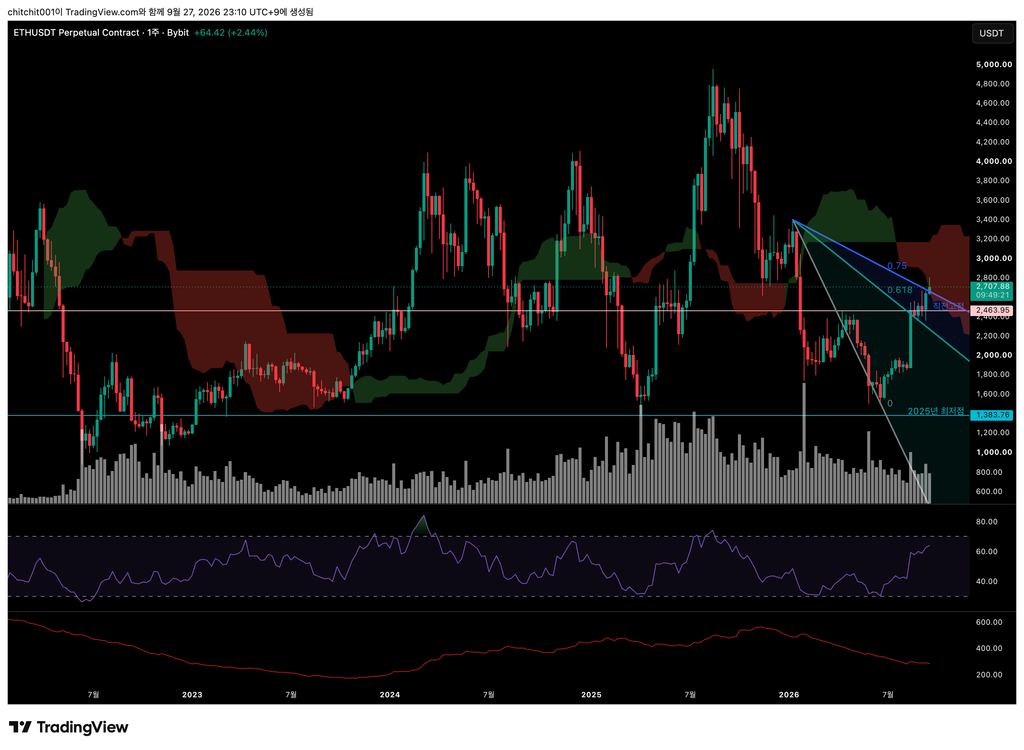
[Weekly Chart]
- The candle’s body is not as large as Bitcoin’s. Although Ethereum has broken above the 0.75 level of the Speed Fan, its momentum appears weaker than Bitcoin’s.
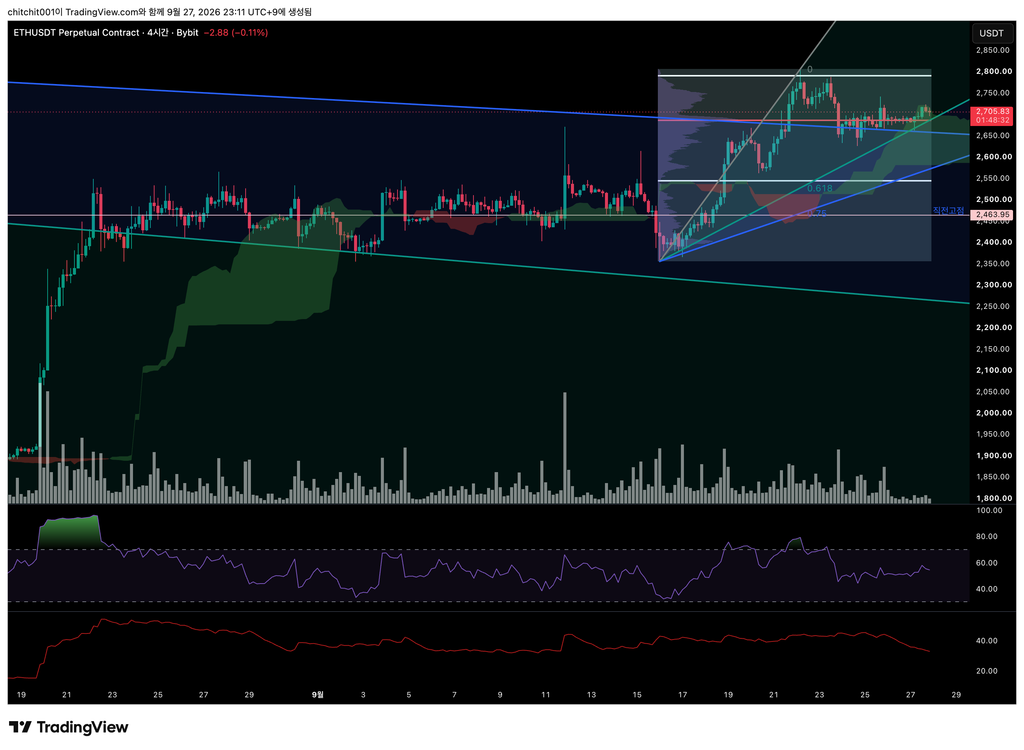
[4-Hour Chart]
- Price moved above the volume profile’s POC but is now falling back. Its momentum is clearly weaker than Bitcoin’s.
- I have also drawn Fibonacci retracement levels for the recent upward move on the 4-hour chart. Price is currently near the 0.618 level. A break below this level could lead to a further decline, while holding it as support could produce a rebound.
- Because the 0.618 level is now above the POC, one possible strategy would be to consider an entry when price reaches the 0.618 level and use the POC as the stop-loss reference.